THE FLODATA CASE INDEX

Different problems. Working answers.

See what changed when the data became usable.

Showing all 11 cases

Case studies

Illustrative plot register with a chain of title and a sector map, using fictional plots, records and dates
CASE/01

A usable system from generations of plot records

Scanned property files became a linked register, with every ownership change traced to its source and every plot on the map.

2026IndiaReal estate
Migration & ModernisationAI EngineeringLocation Intelligence
Under the hoodHide the stack

OCR and document classification · Two-pass AI extraction with validation · Chain-of-title register · Web map with plot polygons · Maker, checker and approver workflows

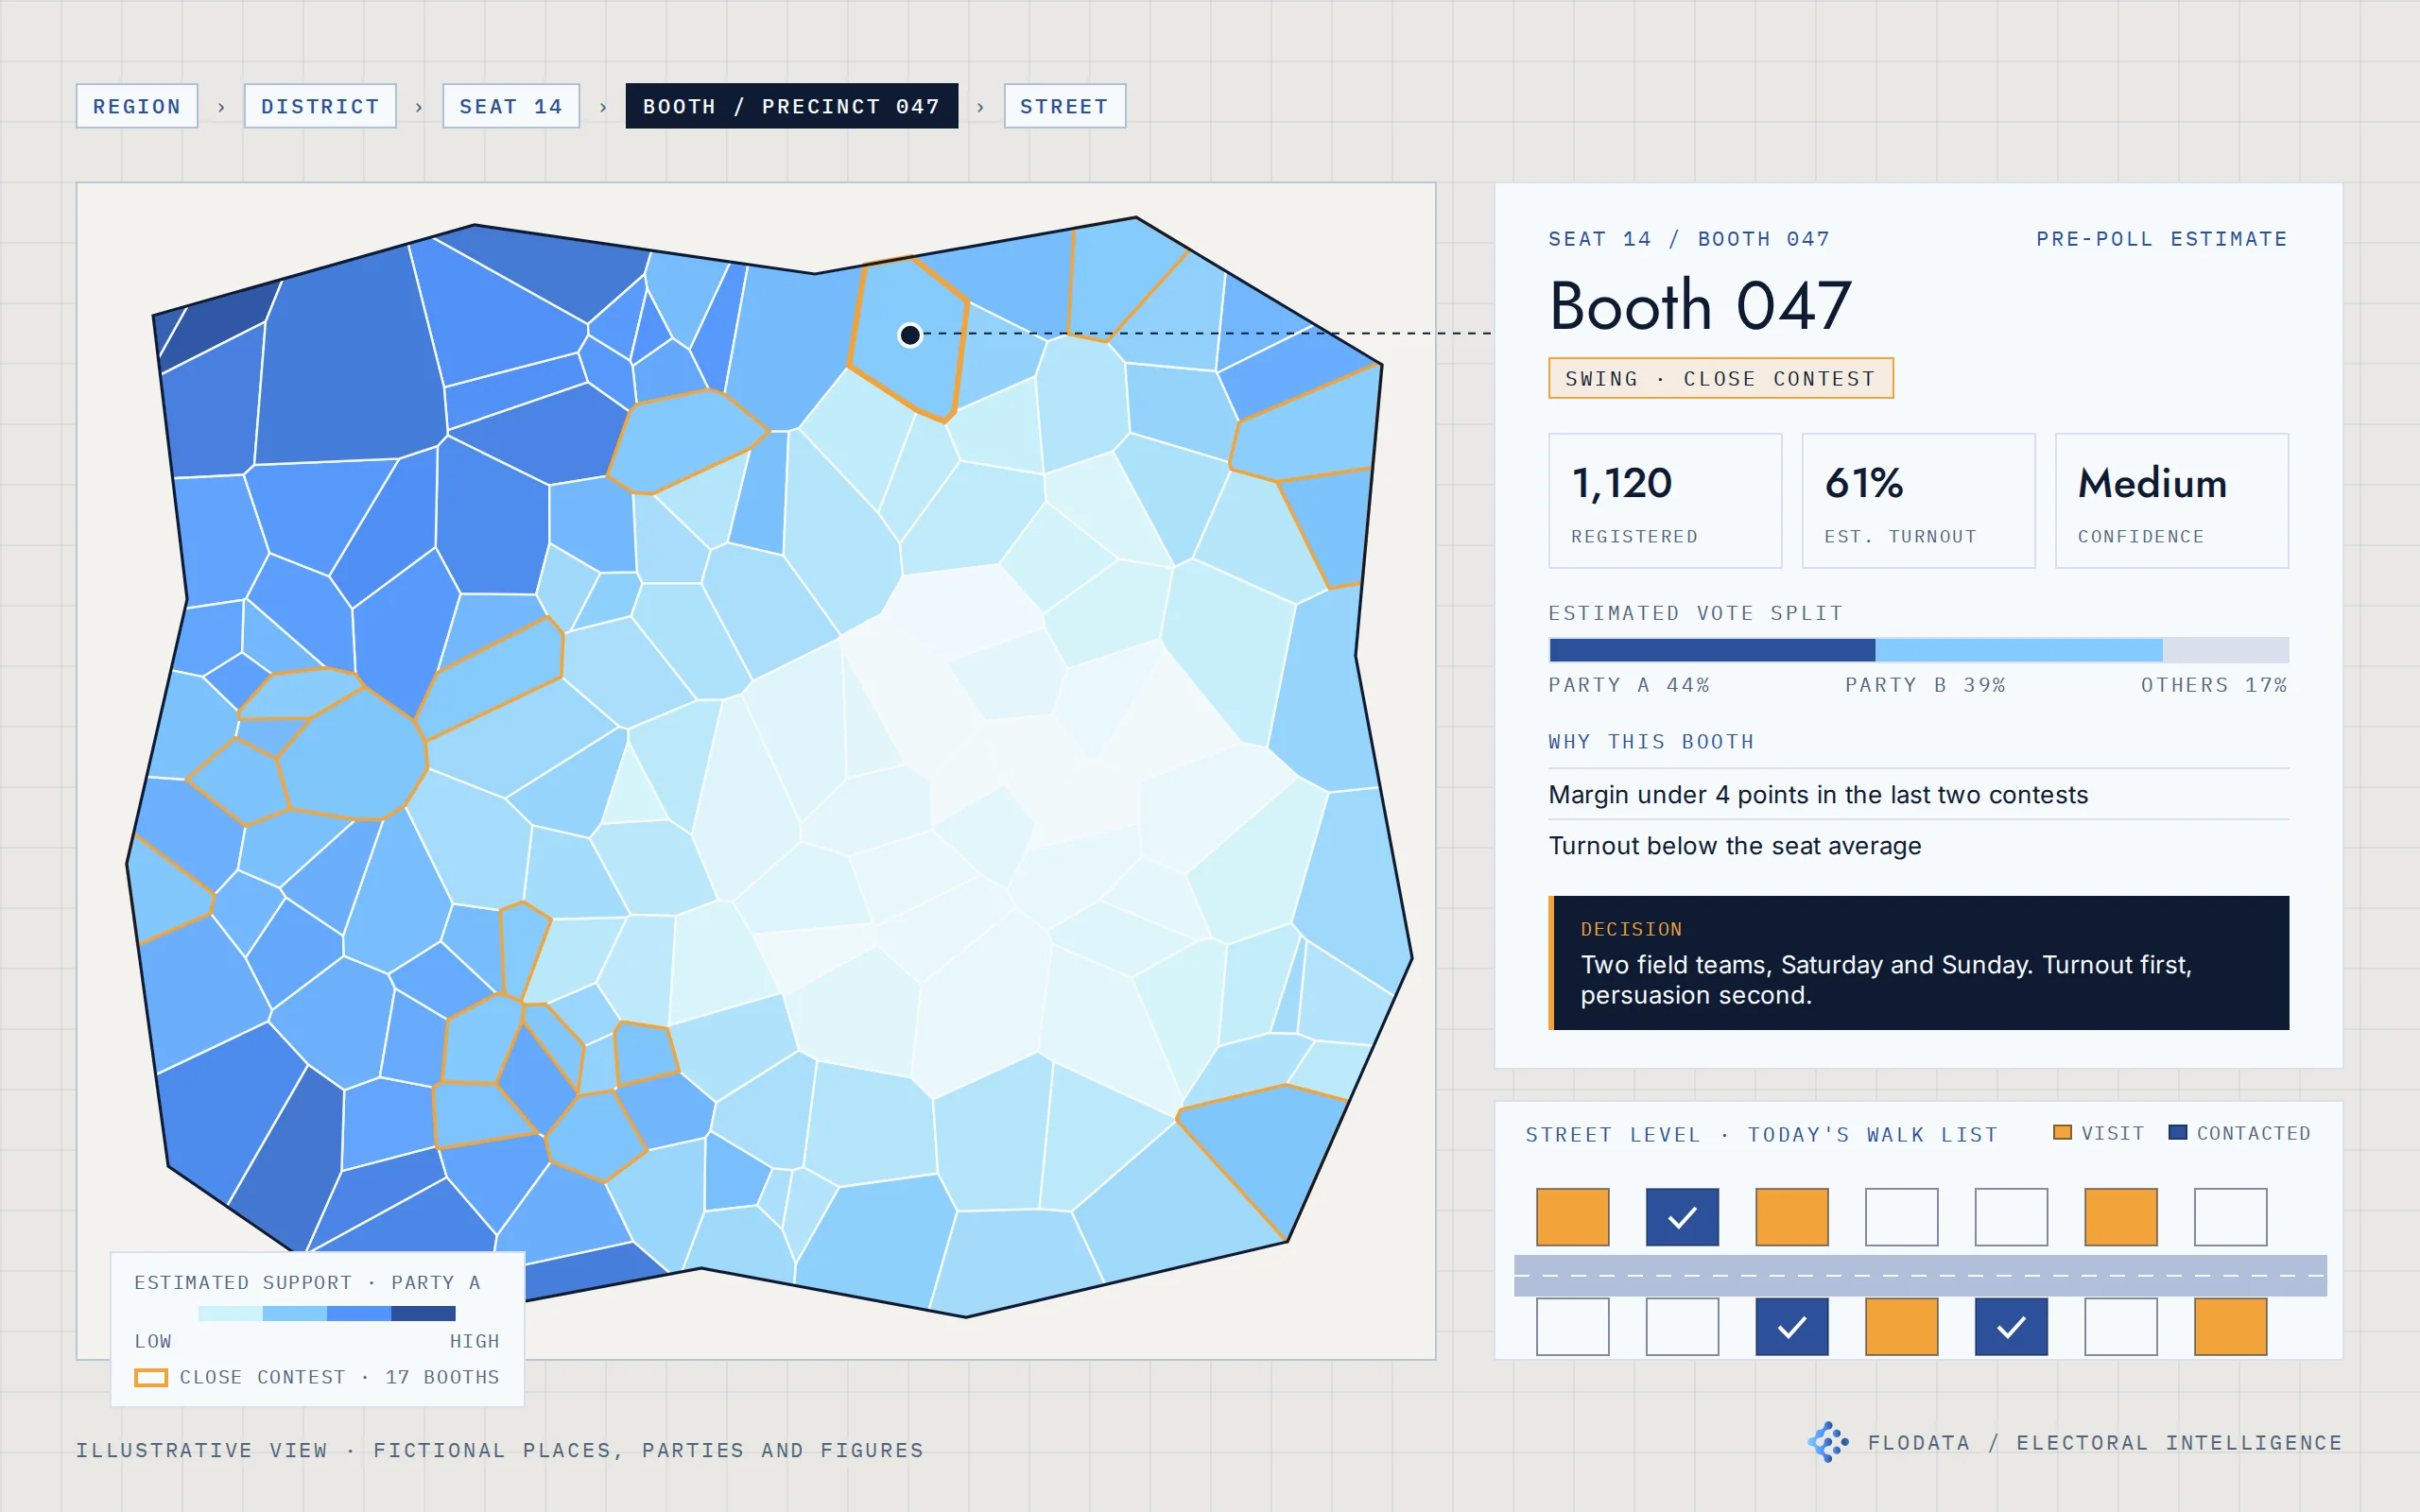
Illustrative booth estimate on a seat map, using fictional places, parties and figures
CASE/02

Where an election is decided, booth by booth

Electoral intelligence for a US campaign and an Indian party organisation. Estimates built from official results, mapped from the seat to the street.

2024 and 2025United States, IndiaCampaigns & public sector
Location IntelligenceAI EngineeringAnalyticsData Engineering & Automation
Under the hoodHide the stack

Official results and electoral rolls from public sources · Booth reconciliation across elections · Segment-level turnout and preference model · Bottom-up aggregation with confidence levels · Web maps from region to household · Prediction service with Excel-ready exports · Web dashboard and mobile field app

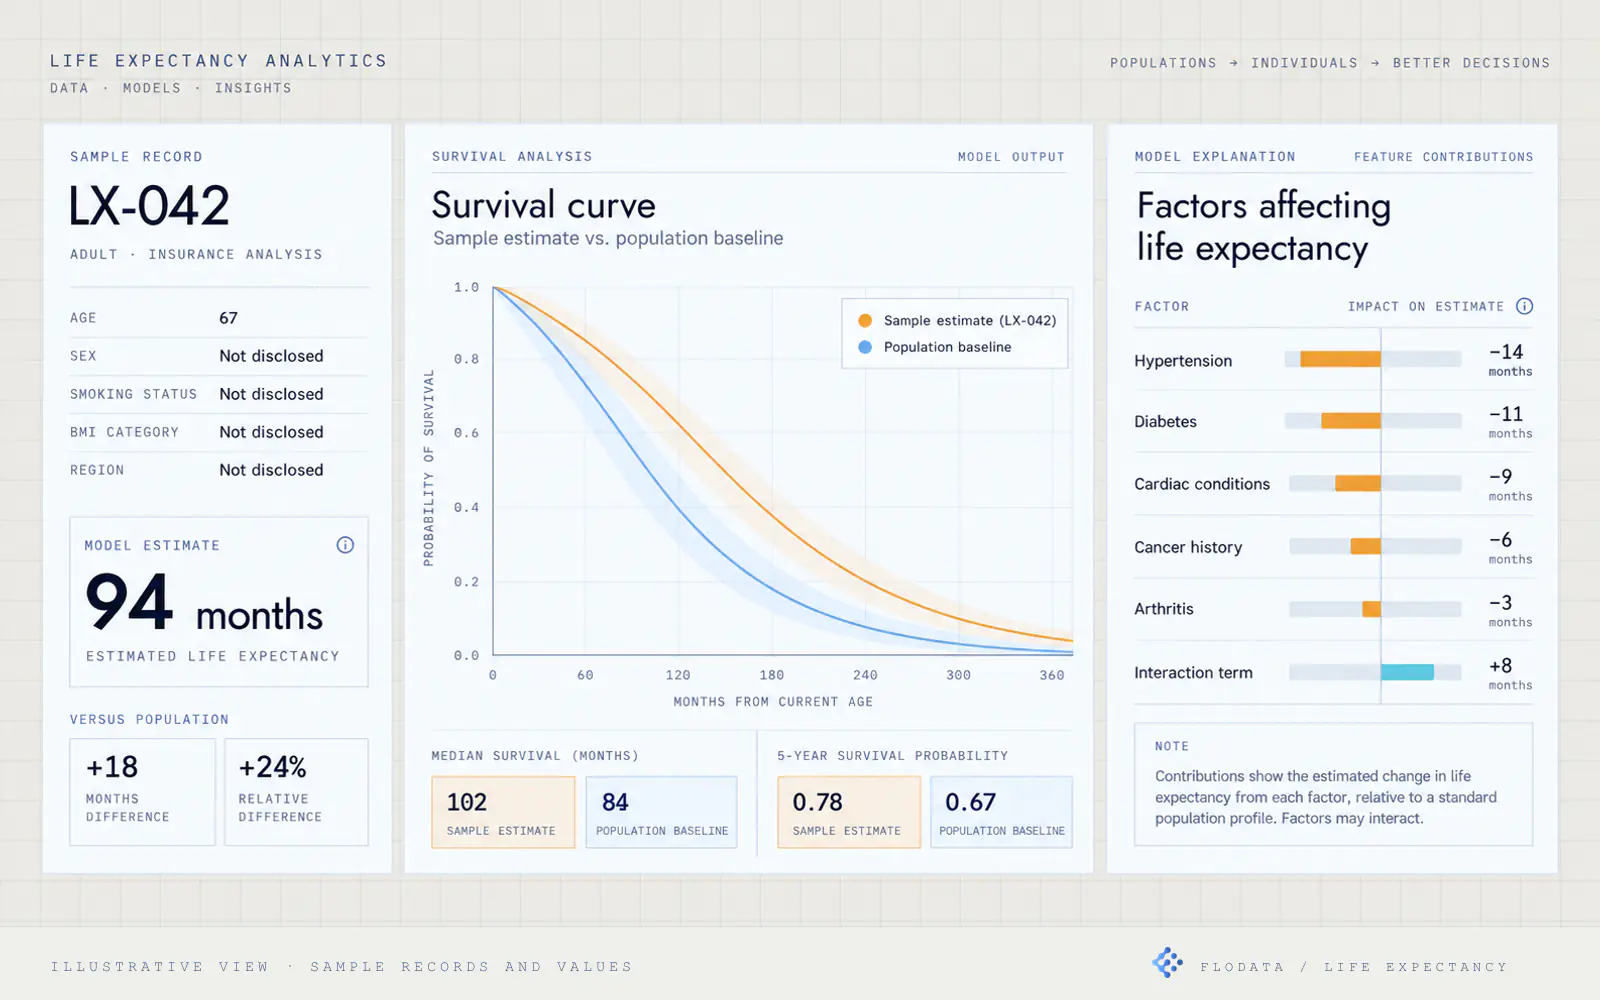
Illustrative decision view with a sample record, survival curve, estimated life expectancy and contributing factors, using sample records and values
CASE/03

Life expectancy modelling for life settlements

Medical records became a structured, explainable input to life-settlement valuation.

2024Florida, USAInsurance & financial services
AI EngineeringAnalytics
Under the hoodHide the stack

OCR and document classification · NLP-based medical factor extraction · Standardised medical and lifestyle factor set · Cox Proportional Hazards survival model · Baseline and factor-contribution dashboard · Benchmark comparison against industry and internal methods

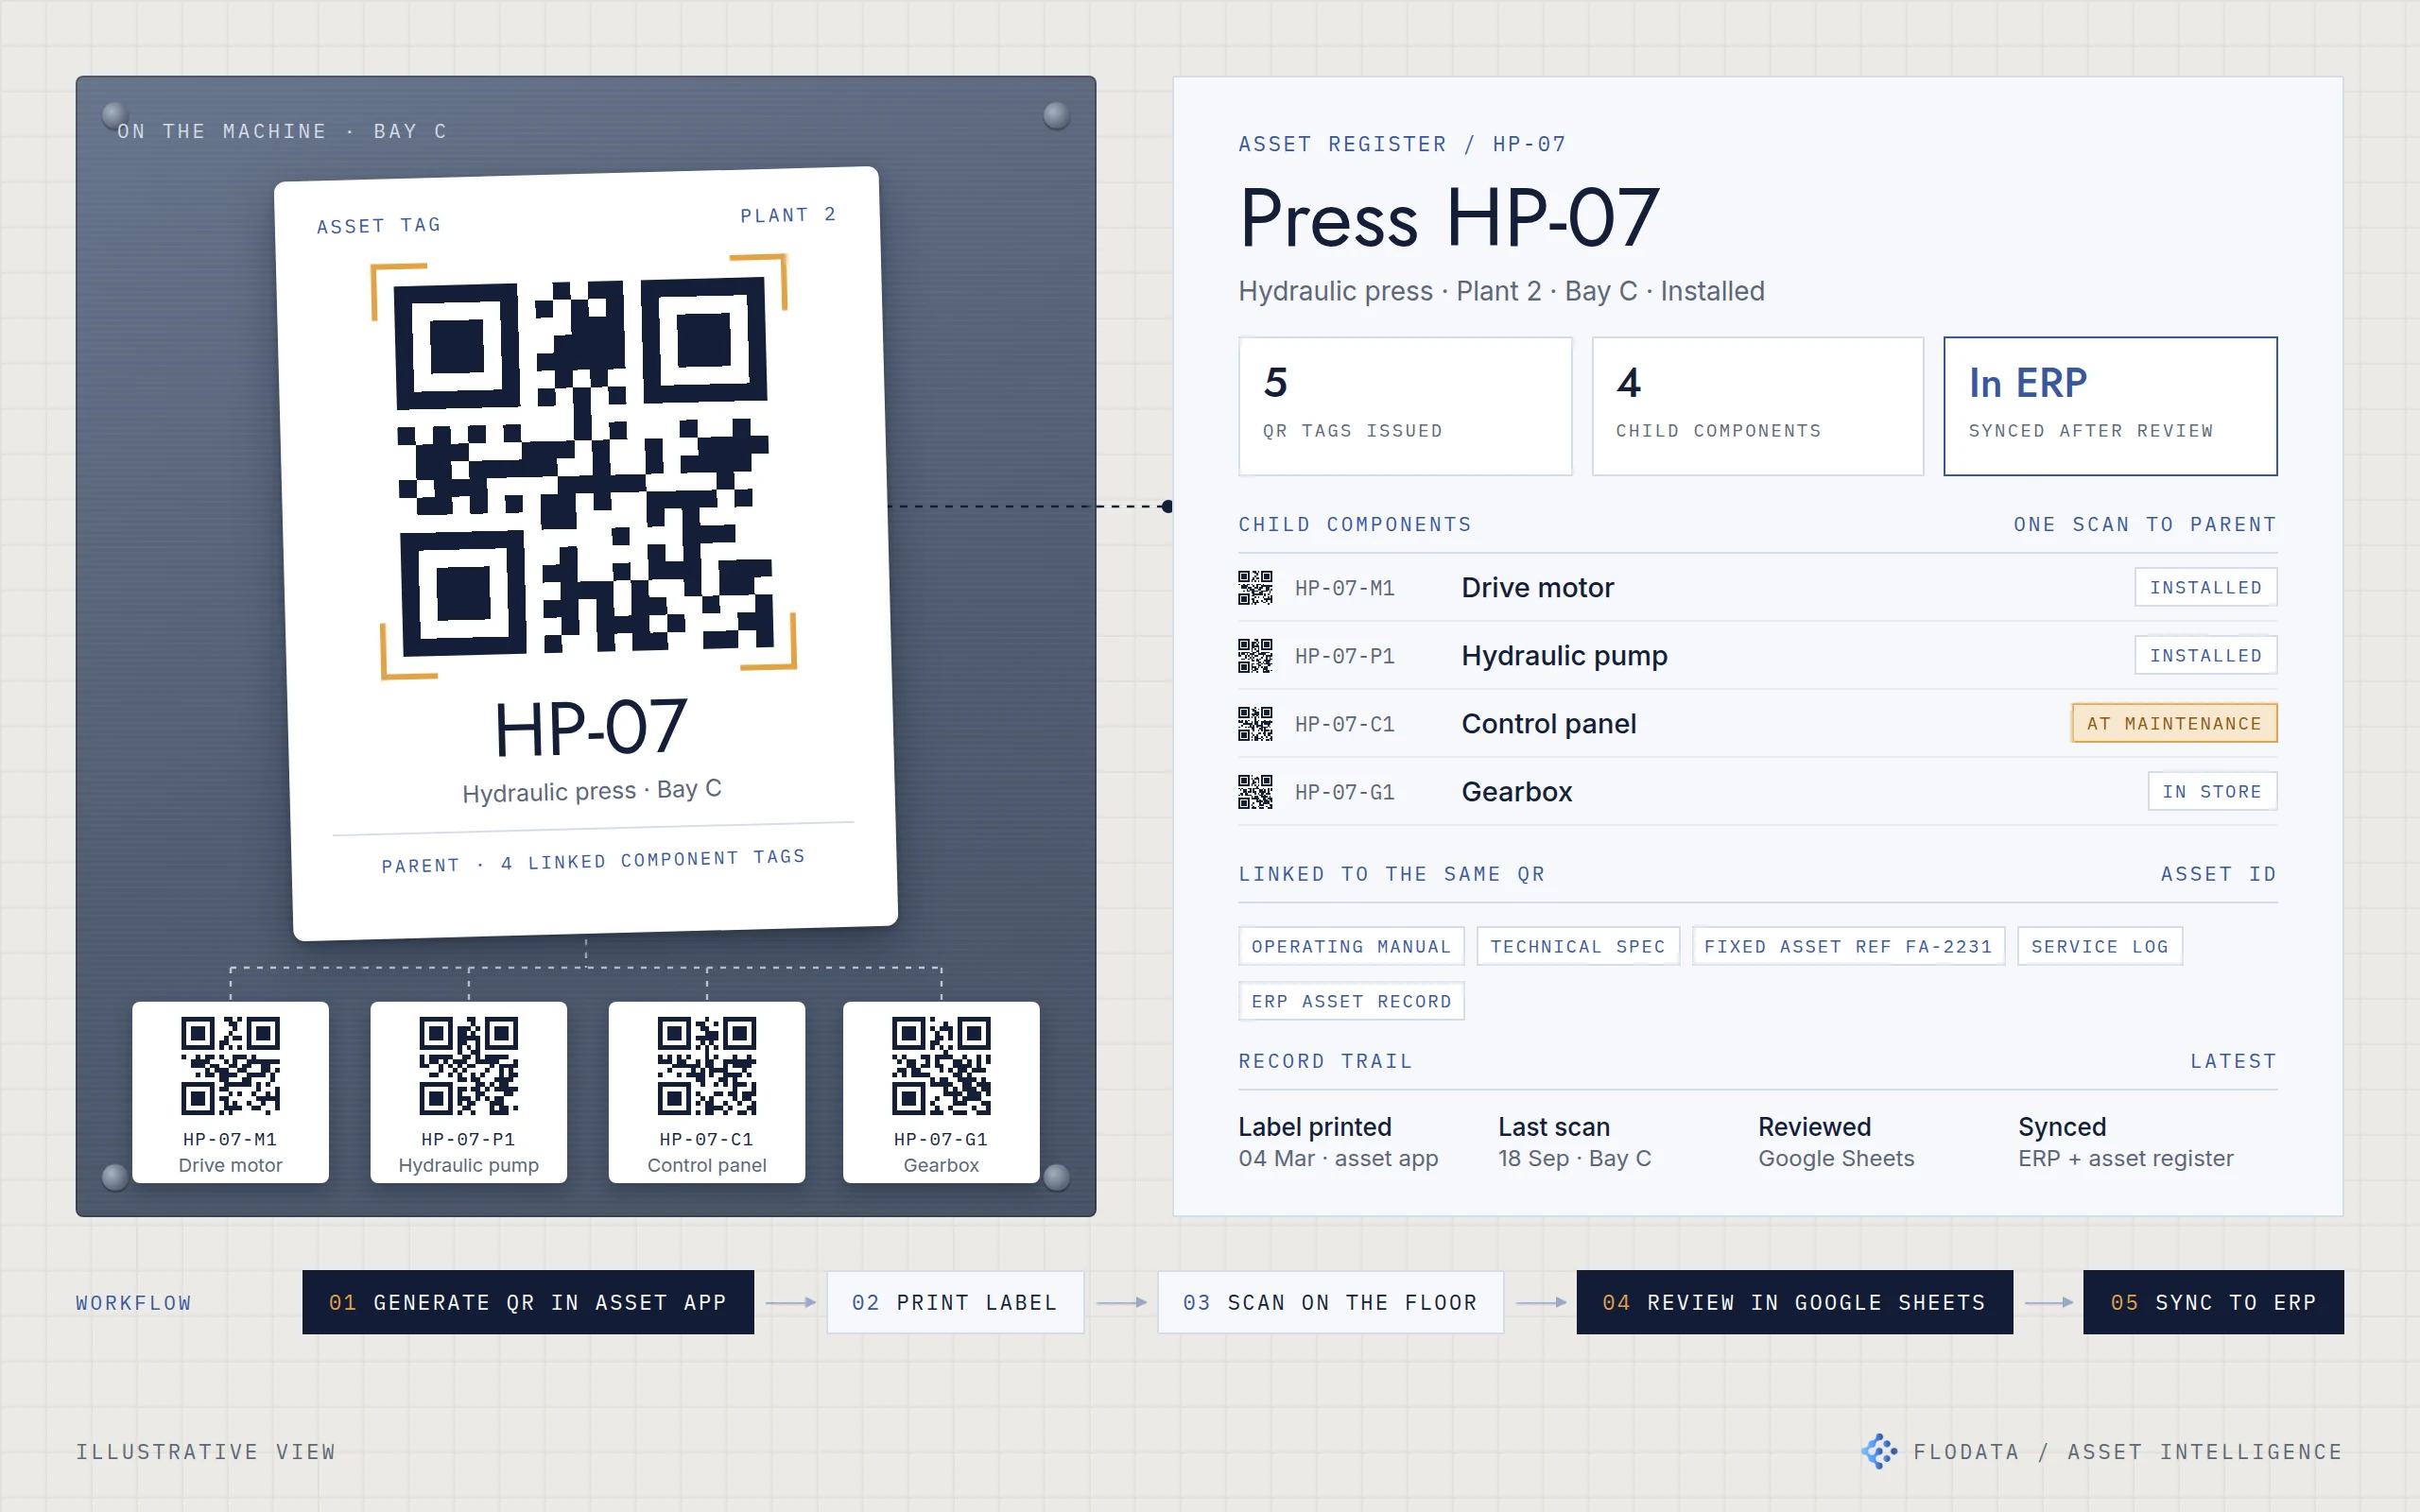
Illustration of a printed QR asset tag on a machine with four linked component tags, connected to its asset register record and a workflow from QR generation and label printing to scanning, Google Sheets review and ERP sync.
CASE/04

One identity for every machine, across plants of every age

A simple asset-control layer gave mixed-generation plants one way to find, verify and service their machinery, without waiting on the ERP.

2026IndiaManufacturing
Data Engineering & AutomationMigration & ModernisationManaged Services
Under the hoodHide the stack

Asset app with QR generation and label printing · Mobile stocktake app · Parent and child asset structure · Google Sheets review workflow · ERP and fixed asset register integration

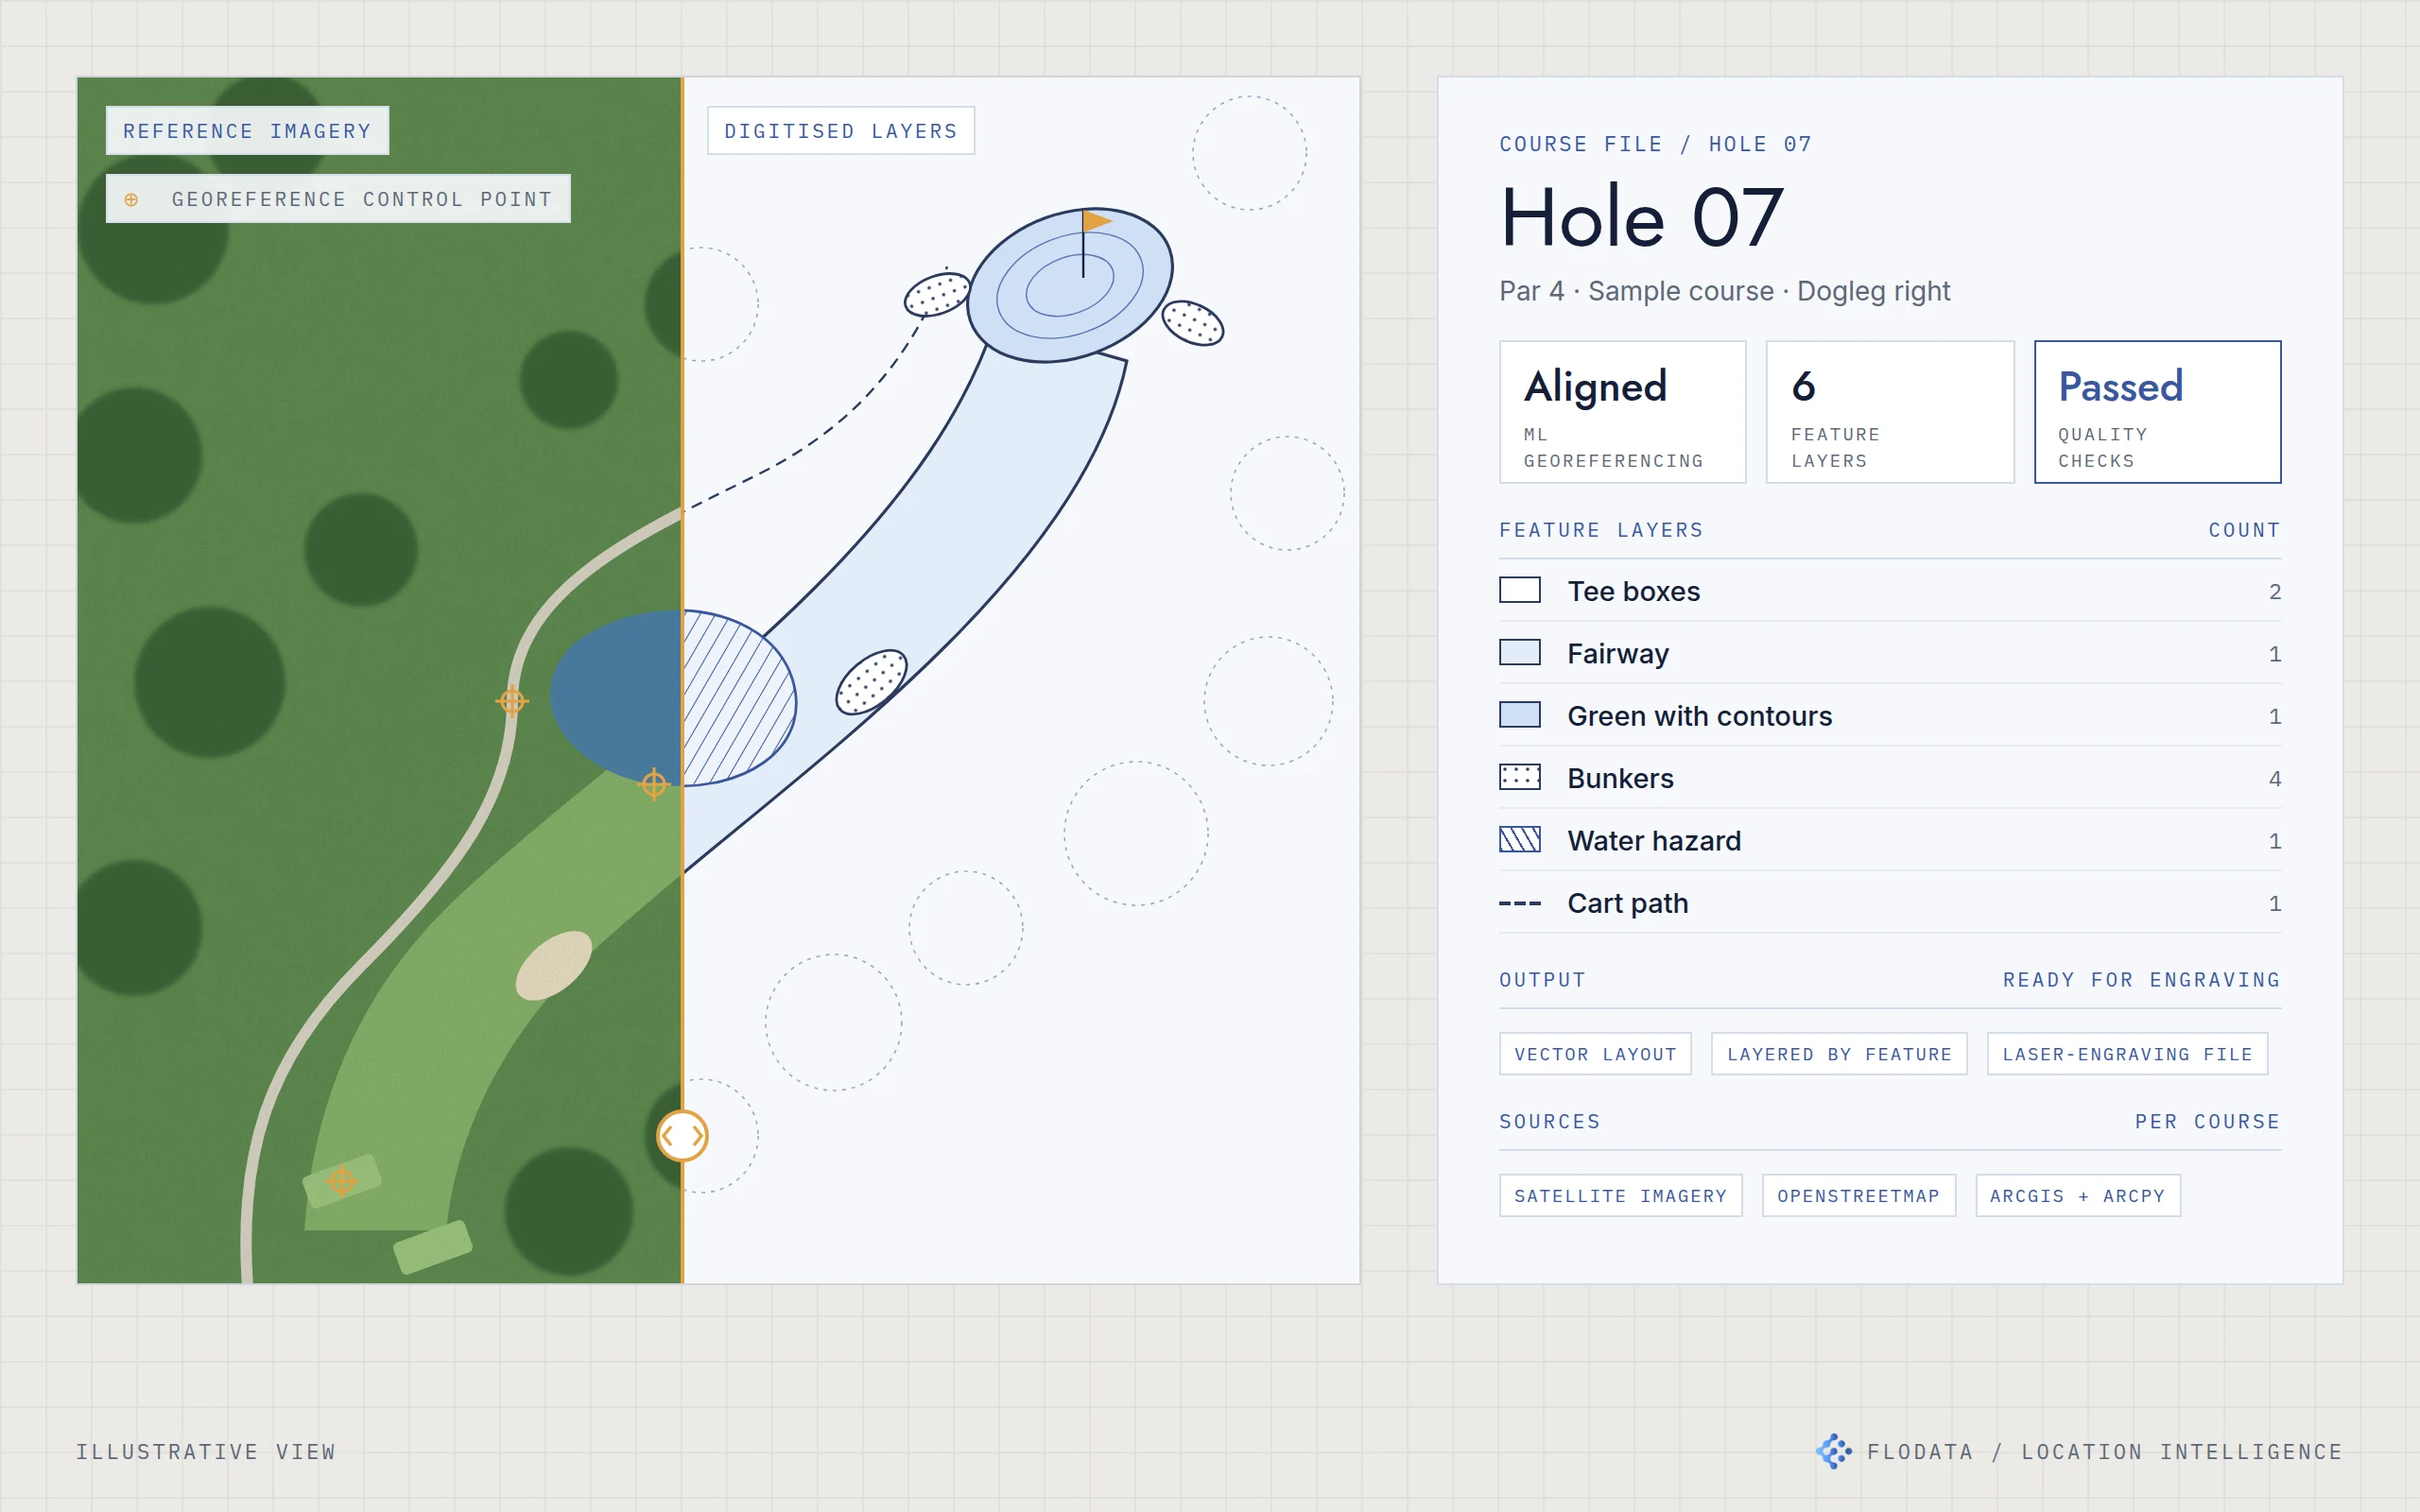
Illustration of one golf hole split in two: reference imagery with georeferencing control points on the left and the digitised fairway, green, bunkers, water and cart path layers on the right, linked to a course file card showing its feature layers and quality check status.
CASE/05

Golf course maps accurate enough to engrave

Course maps for a US map publisher, digitised feature by feature and ready for laser engraving, in less time and at lower cost per course.

2023United StatesSports & leisure
Location IntelligenceAI EngineeringData Engineering & Automation
Under the hoodHide the stack

ML georeferencing · ArcGIS and ArcPy · Python automation · OpenStreetMap and satellite imagery · Feature-level QA

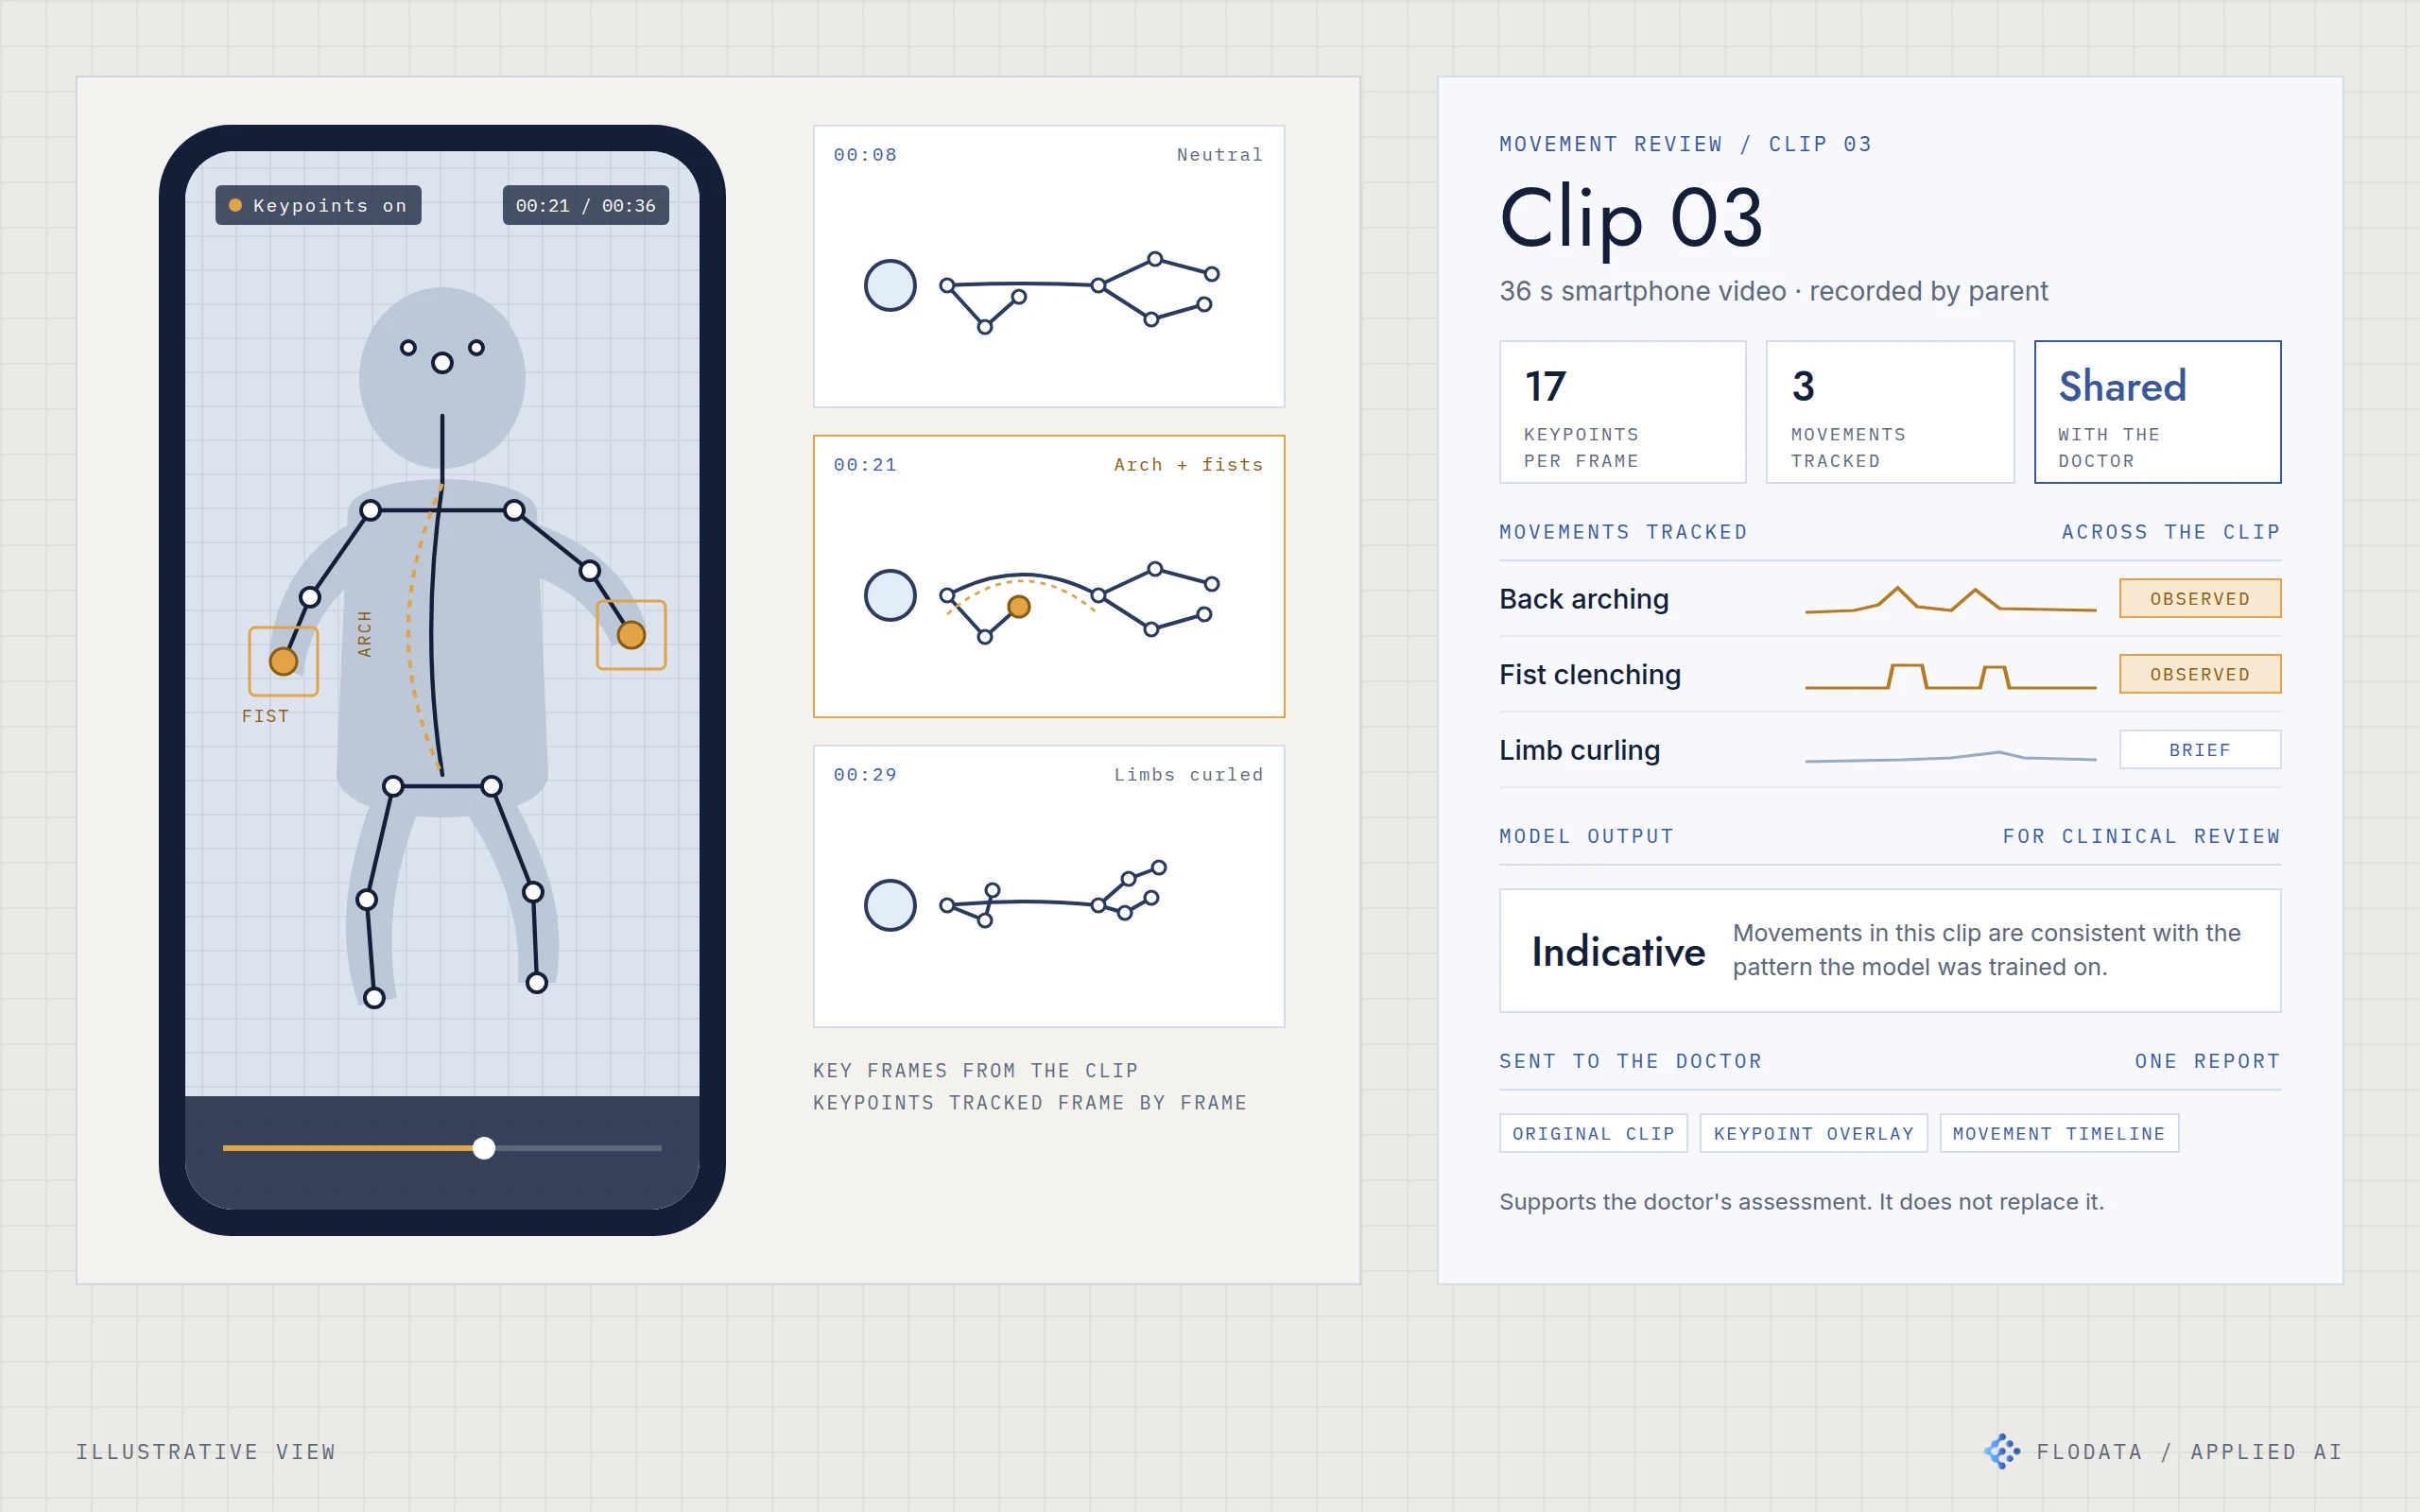
Illustration of a smartphone playing a home video with a keypoint skeleton drawn over an abstract child figure, three key frames showing neutral, arched and curled positions, and a movement review card listing back arching, fist clenching and limb curling with the model output marked for clinical review.
CASE/06

Reading a child's movements from a phone video

Smartphone videos of children became a measured movement record, so parents and doctors could discuss what they saw with something objective in front of them.

2022HungaryHealthcare
AI EngineeringAnalytics
Under the hoodHide the stack

Pose estimation · Keypoint detection · Movement signal extraction · Trained classifier · Clinician-facing report

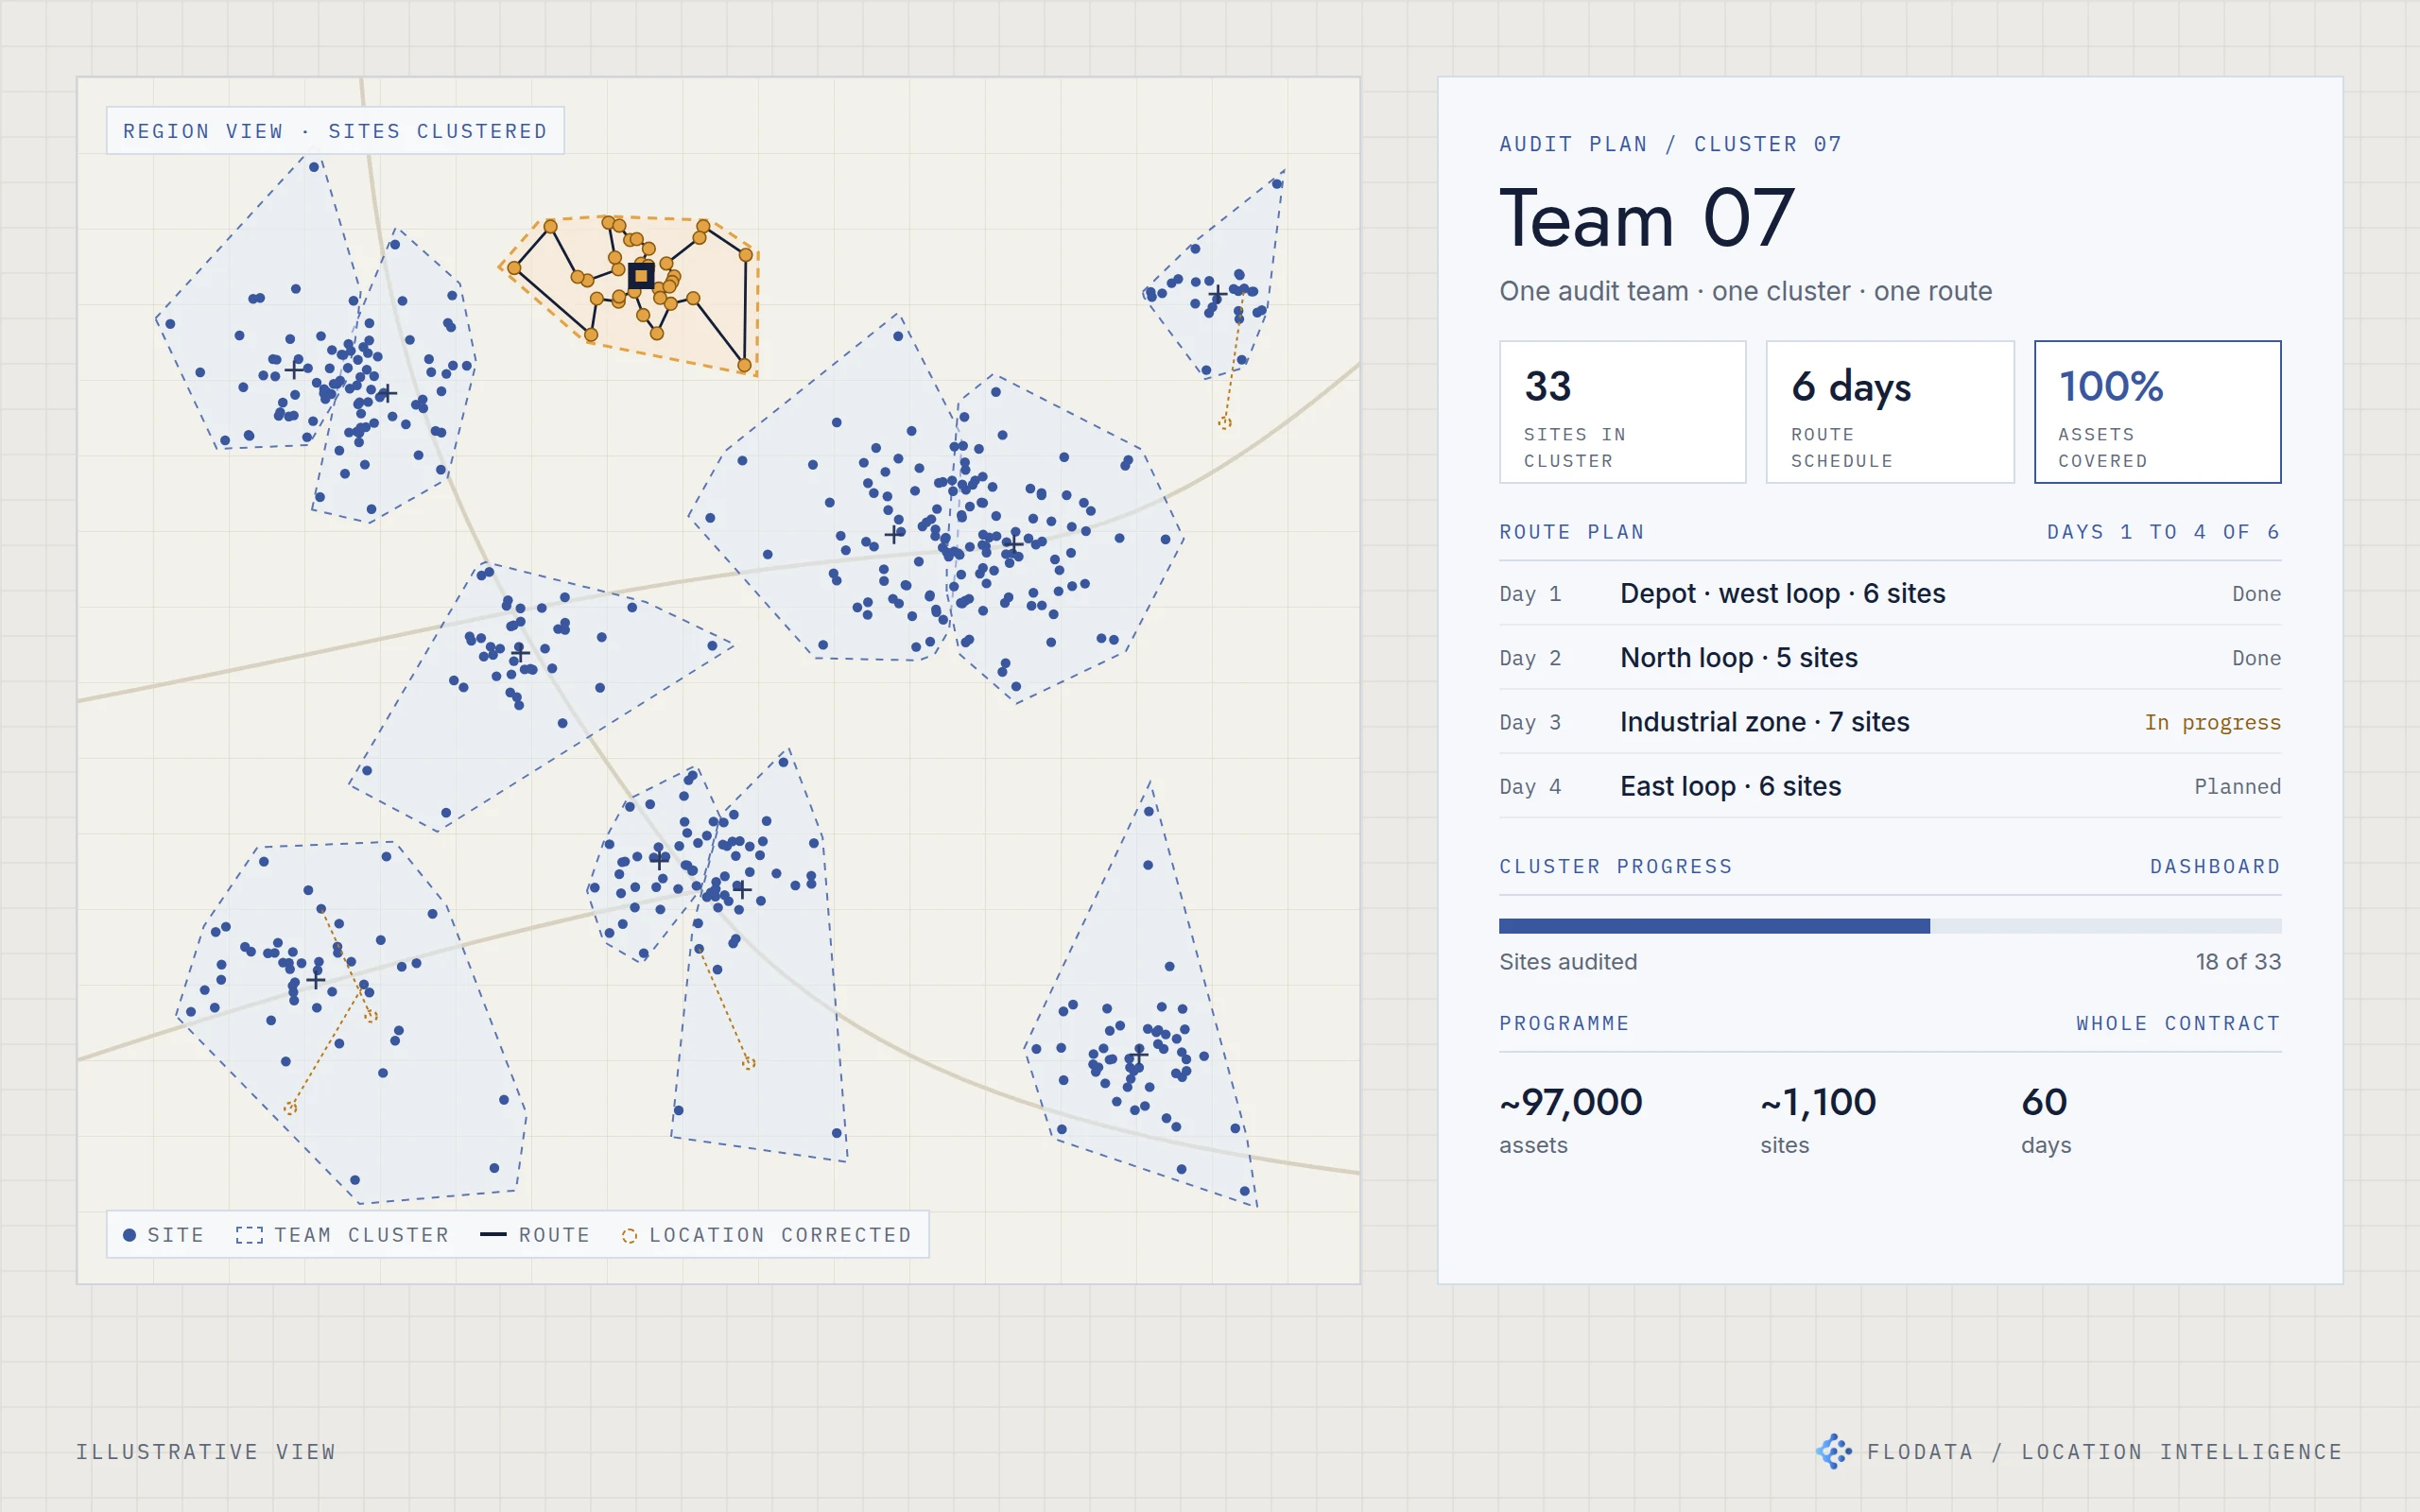
Illustration of a regional map with sites grouped into team clusters, one cluster highlighted with its daily route from a depot and a few corrected site locations, linked to an audit plan card showing the team's sites, daily loops, progress and the programme's 97,000 assets, 1,100 sites and 60 days.
CASE/07

97,000 assets audited in 60 days with a third fewer teams

A facility maintenance provider planned an audit of about 97,000 assets across 1,100 sites in 60 days, with about 35% fewer teams than it first estimated.

2023Saudi ArabiaFacilities management
Location IntelligenceAnalyticsData Engineering & Automation
Under the hoodHide the stack

QGIS spatial cleaning · K-means clustering in Python · Route planning · ArcGIS dashboard

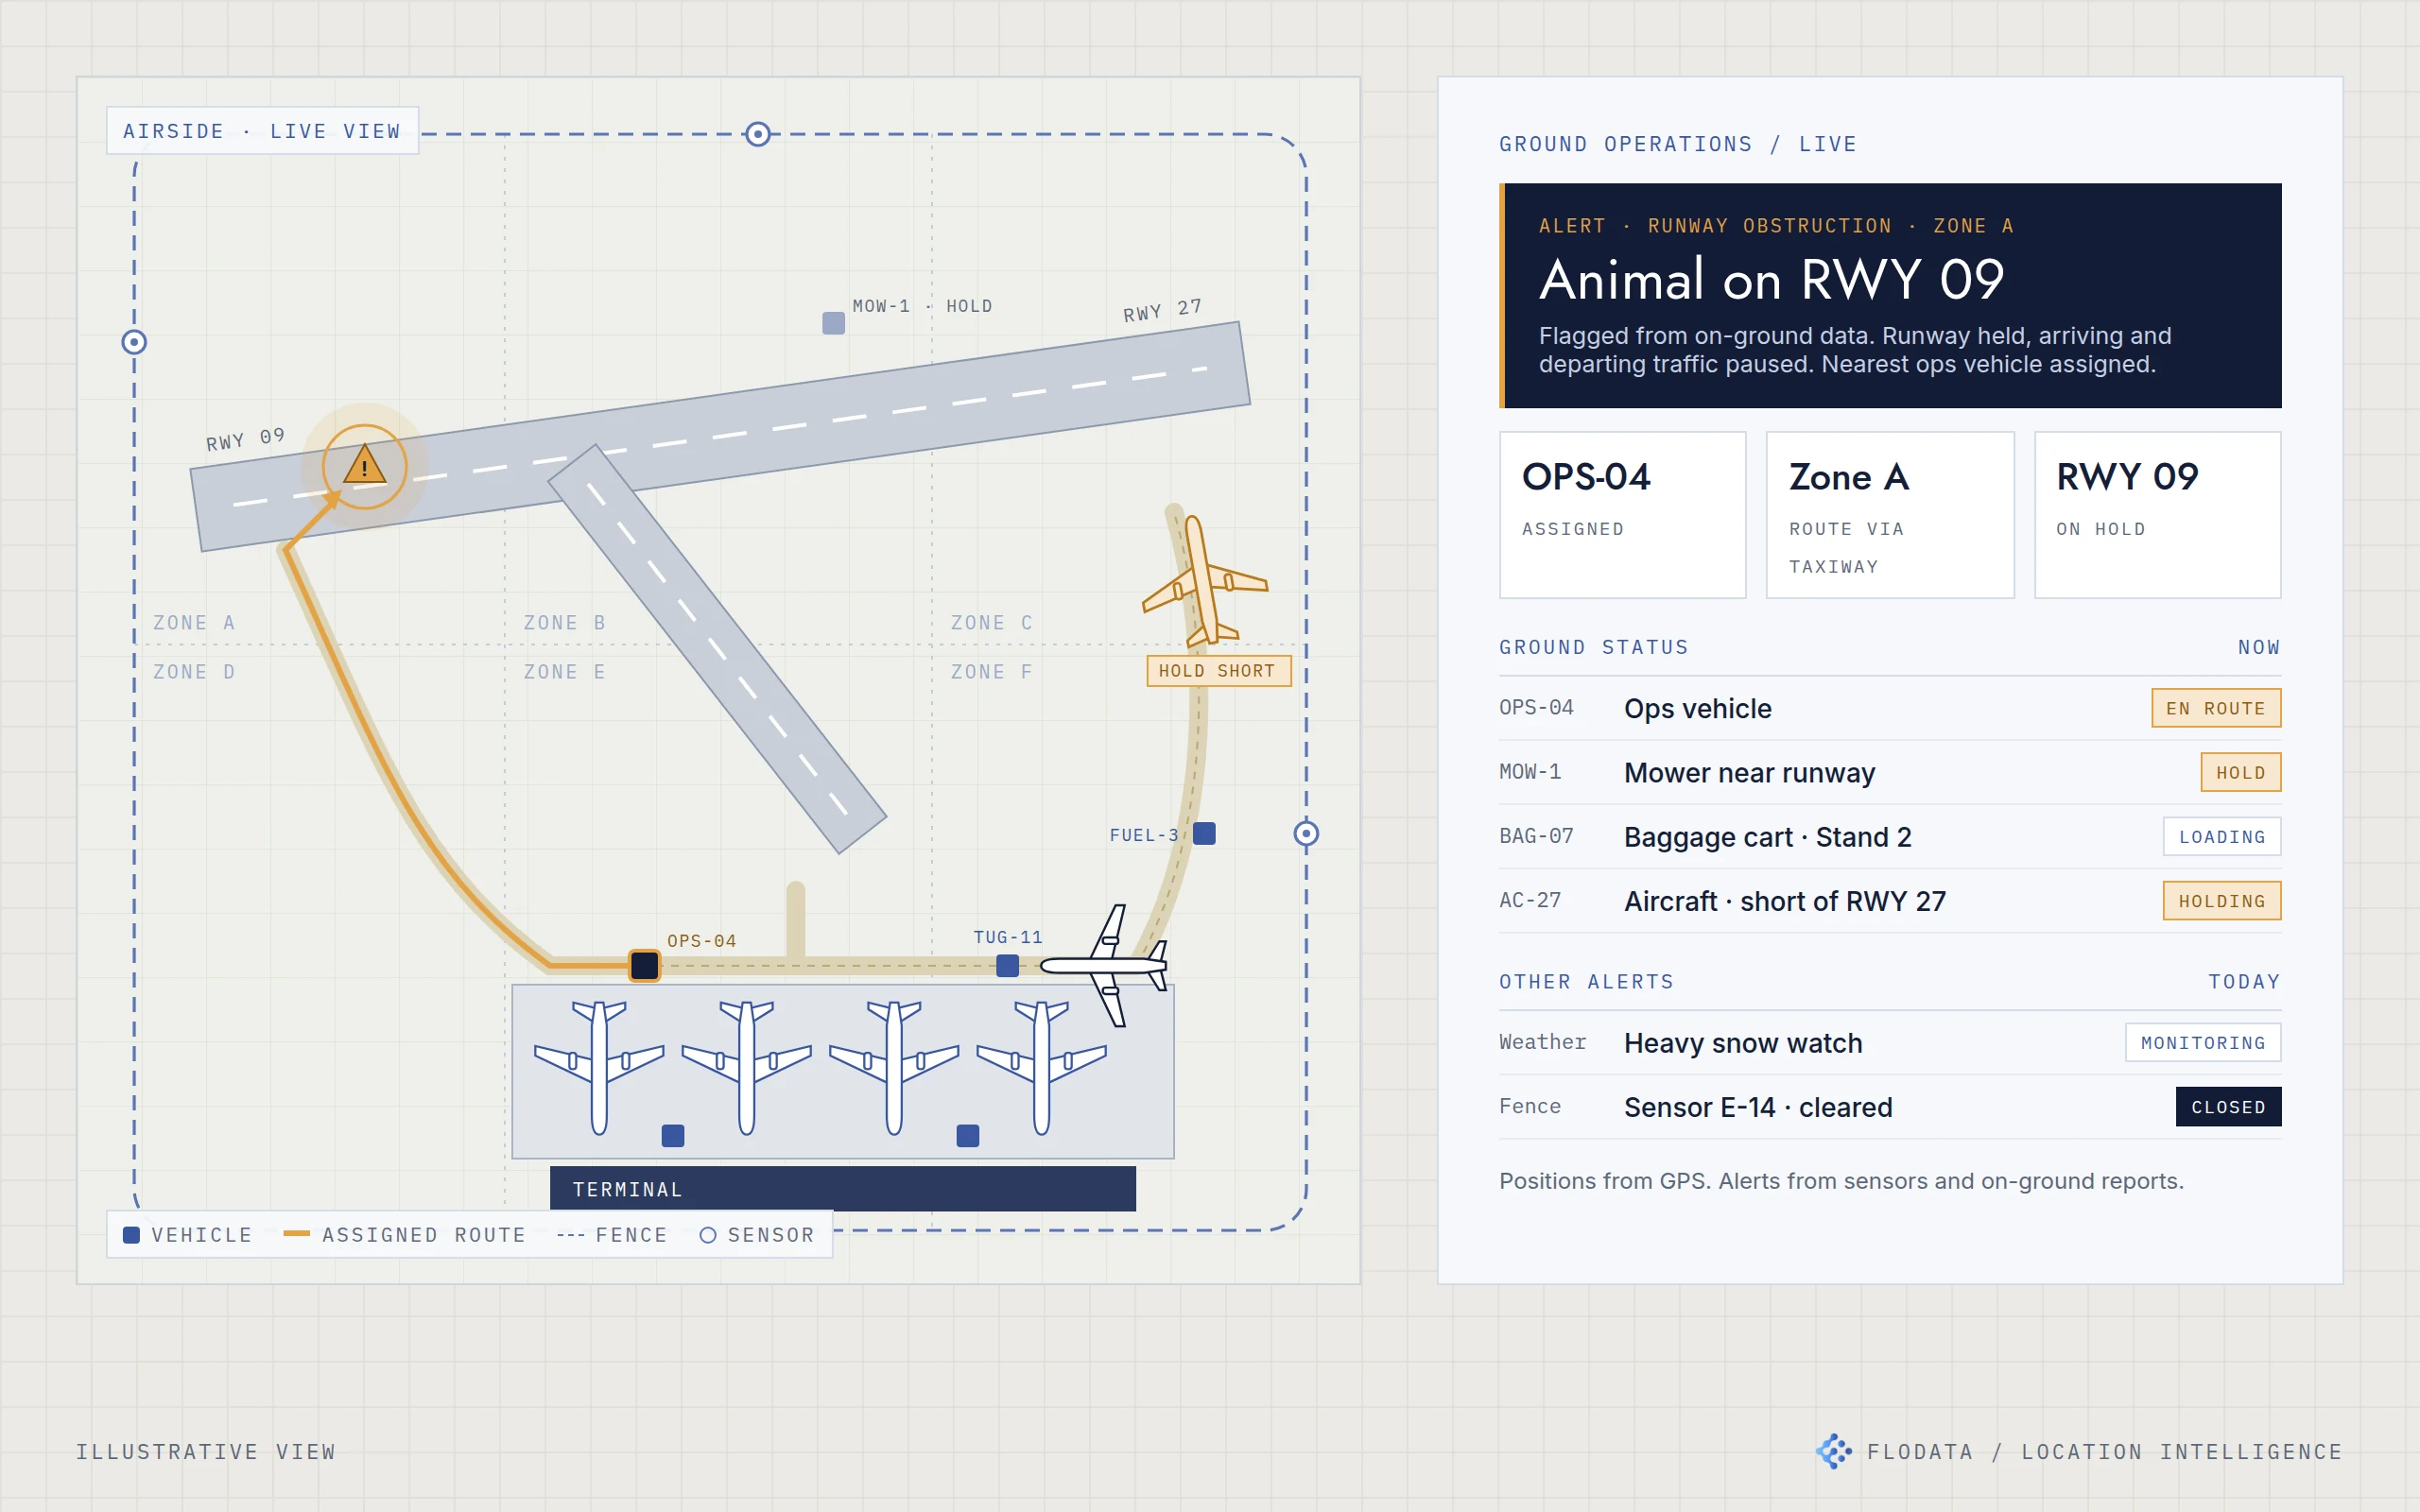
Illustration of an airfield with runways, taxiways, four aircraft parked at the terminal, one under tow and one holding short of the runway, ground vehicles tracked by GPS and perimeter sensors along the fence. A runway obstruction alert shows the nearest ops vehicle routed to it, beside a live operations card listing the alert, vehicle and aircraft status and other alerts.
CASE/08

A live view of the airside, instead of the radio

Ground teams at several US airports moved from radio calls to a shared live map of vehicles, luggage and incidents.

2022United StatesAviation
Location IntelligenceData Engineering & AutomationAnalytics
Under the hoodHide the stack

GPS vehicle tracking · Sensor integration · Live airside map · Location-based alerting · Zone-based routing

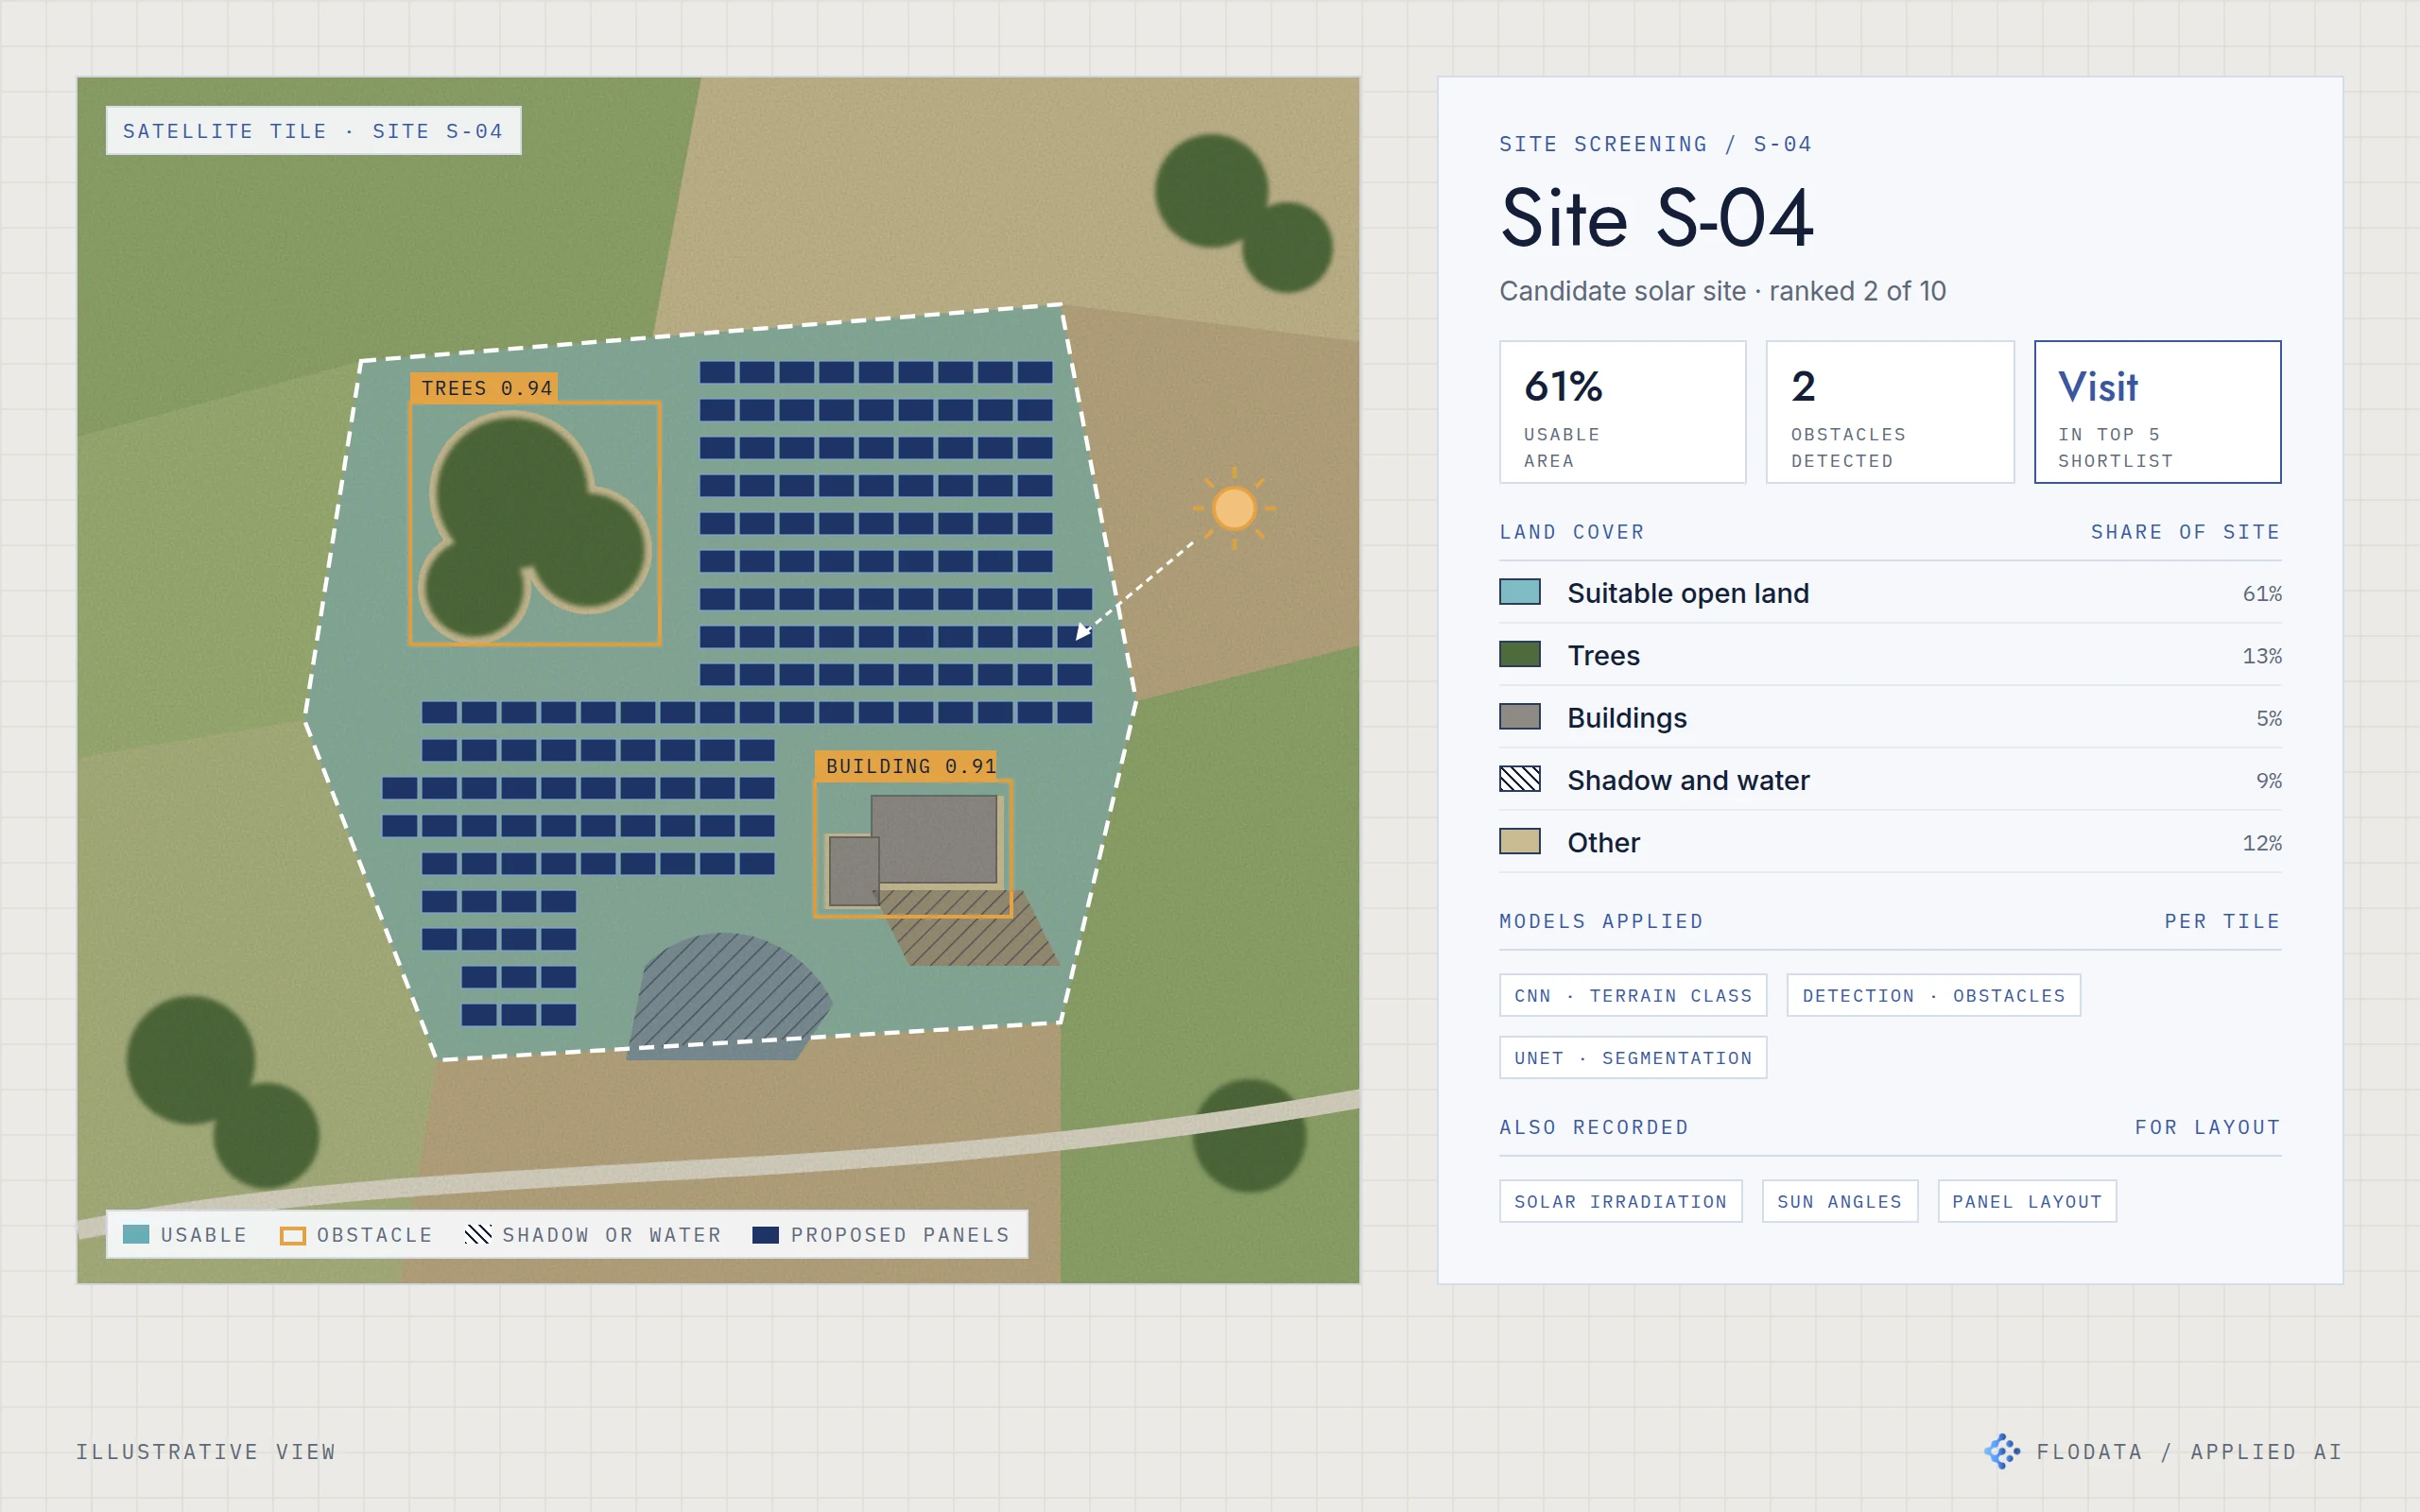
Illustration of a satellite tile of a candidate solar site with usable land segmented, trees and a building detected as obstacles, shadow and water areas hatched and a proposed panel layout in the open land, beside a site screening card showing land cover shares, the models applied and the site ranked into the top five for a visit.
CASE/09

Half the site visits to choose a solar site

Satellite imagery screened candidate solar sites before anyone travelled, so only the top five of ten needed a visit.

2024United StatesEnergy
AI EngineeringLocation Intelligence
Under the hoodHide the stack

CNN terrain classification · YOLO and Faster R-CNN detection · UNet segmentation · Irradiation and sun angle data · Drone inspection integration

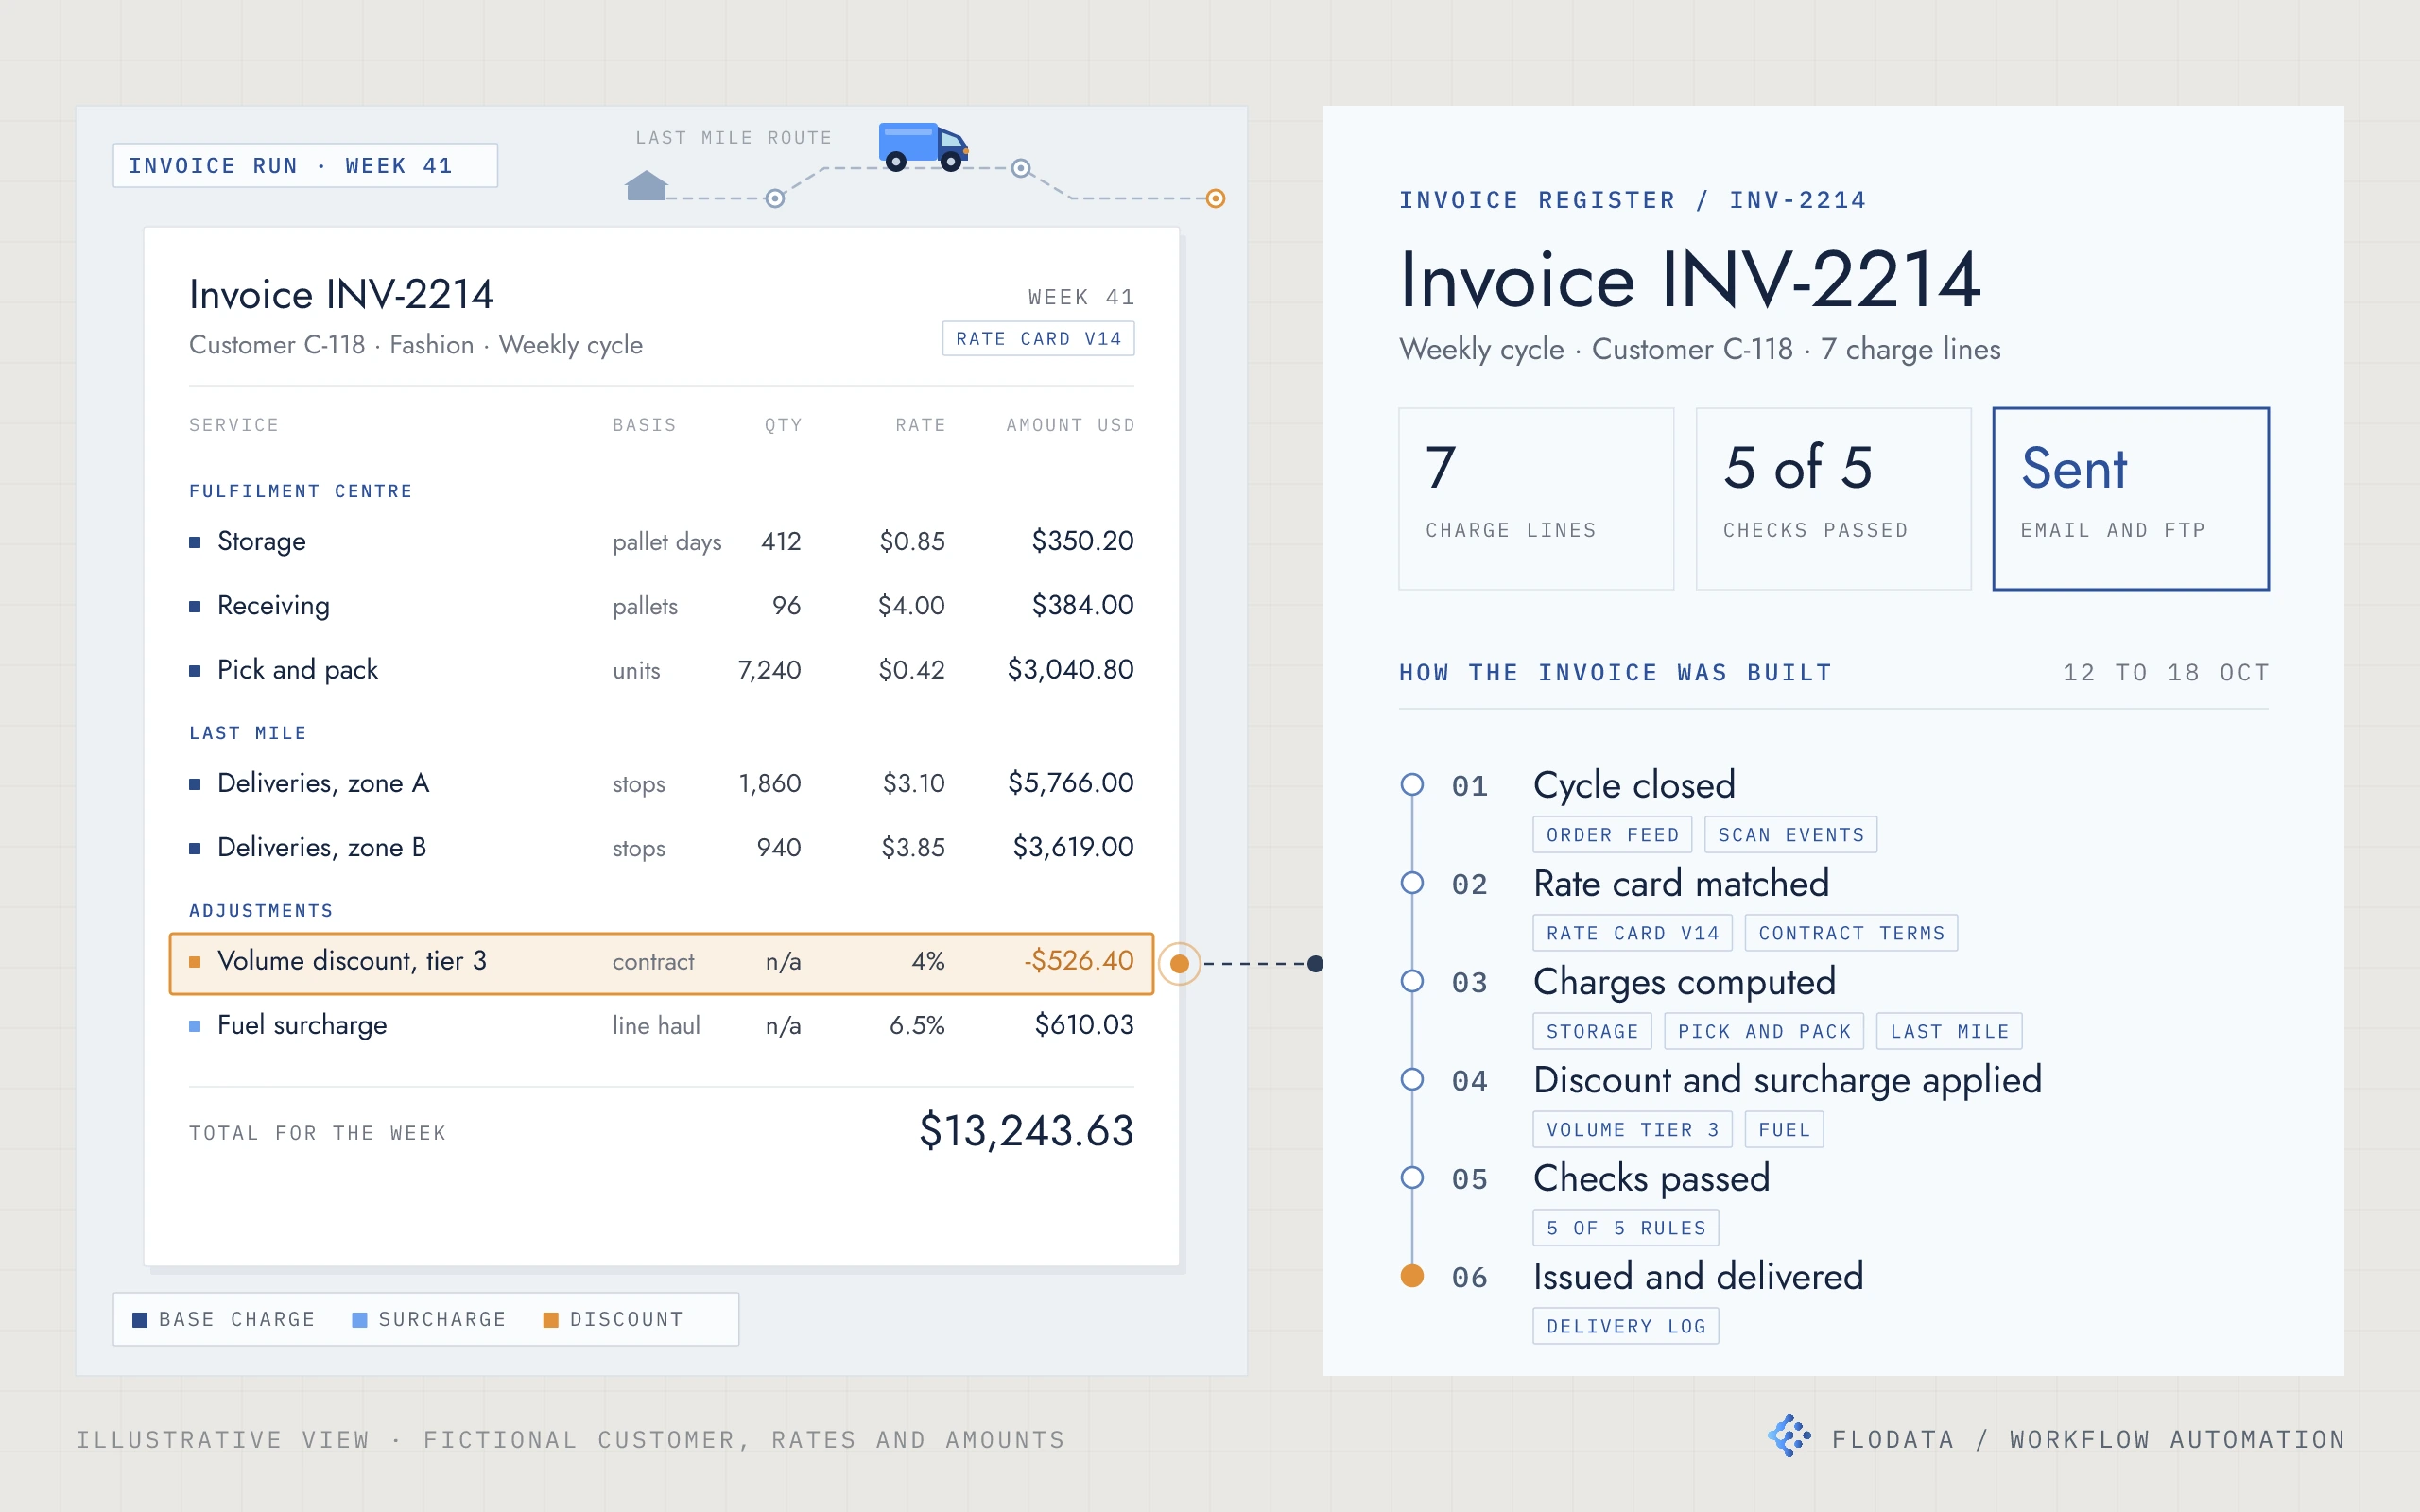
Illustration of a weekly invoice for a fictional customer, with charge lines in dollars for storage, receiving, pick and pack and last mile deliveries, a volume discount line highlighted and linked to an invoice register card showing the charge line count, checks passed, delivery channel and the six stages the invoice passed through from cycle close to delivery. A small delivery van runs a dashed route between stops above the invoice.
CASE/10

Weekly invoices built from the data, not by hand

A fulfilment and last mile provider's weekly invoicing now runs from its own data, with every rate, discount and surcharge applied and checked before anything is sent.

2022United StatesLogistics and fulfilment
Data Engineering & AutomationManaged Services
Under the hoodHide the stack

PostgreSQL data store · Python computation · Cloud workflow automation · Rule-based invoice checks · Per-customer invoice formats · Scheduled delivery by email, FTP or file upload

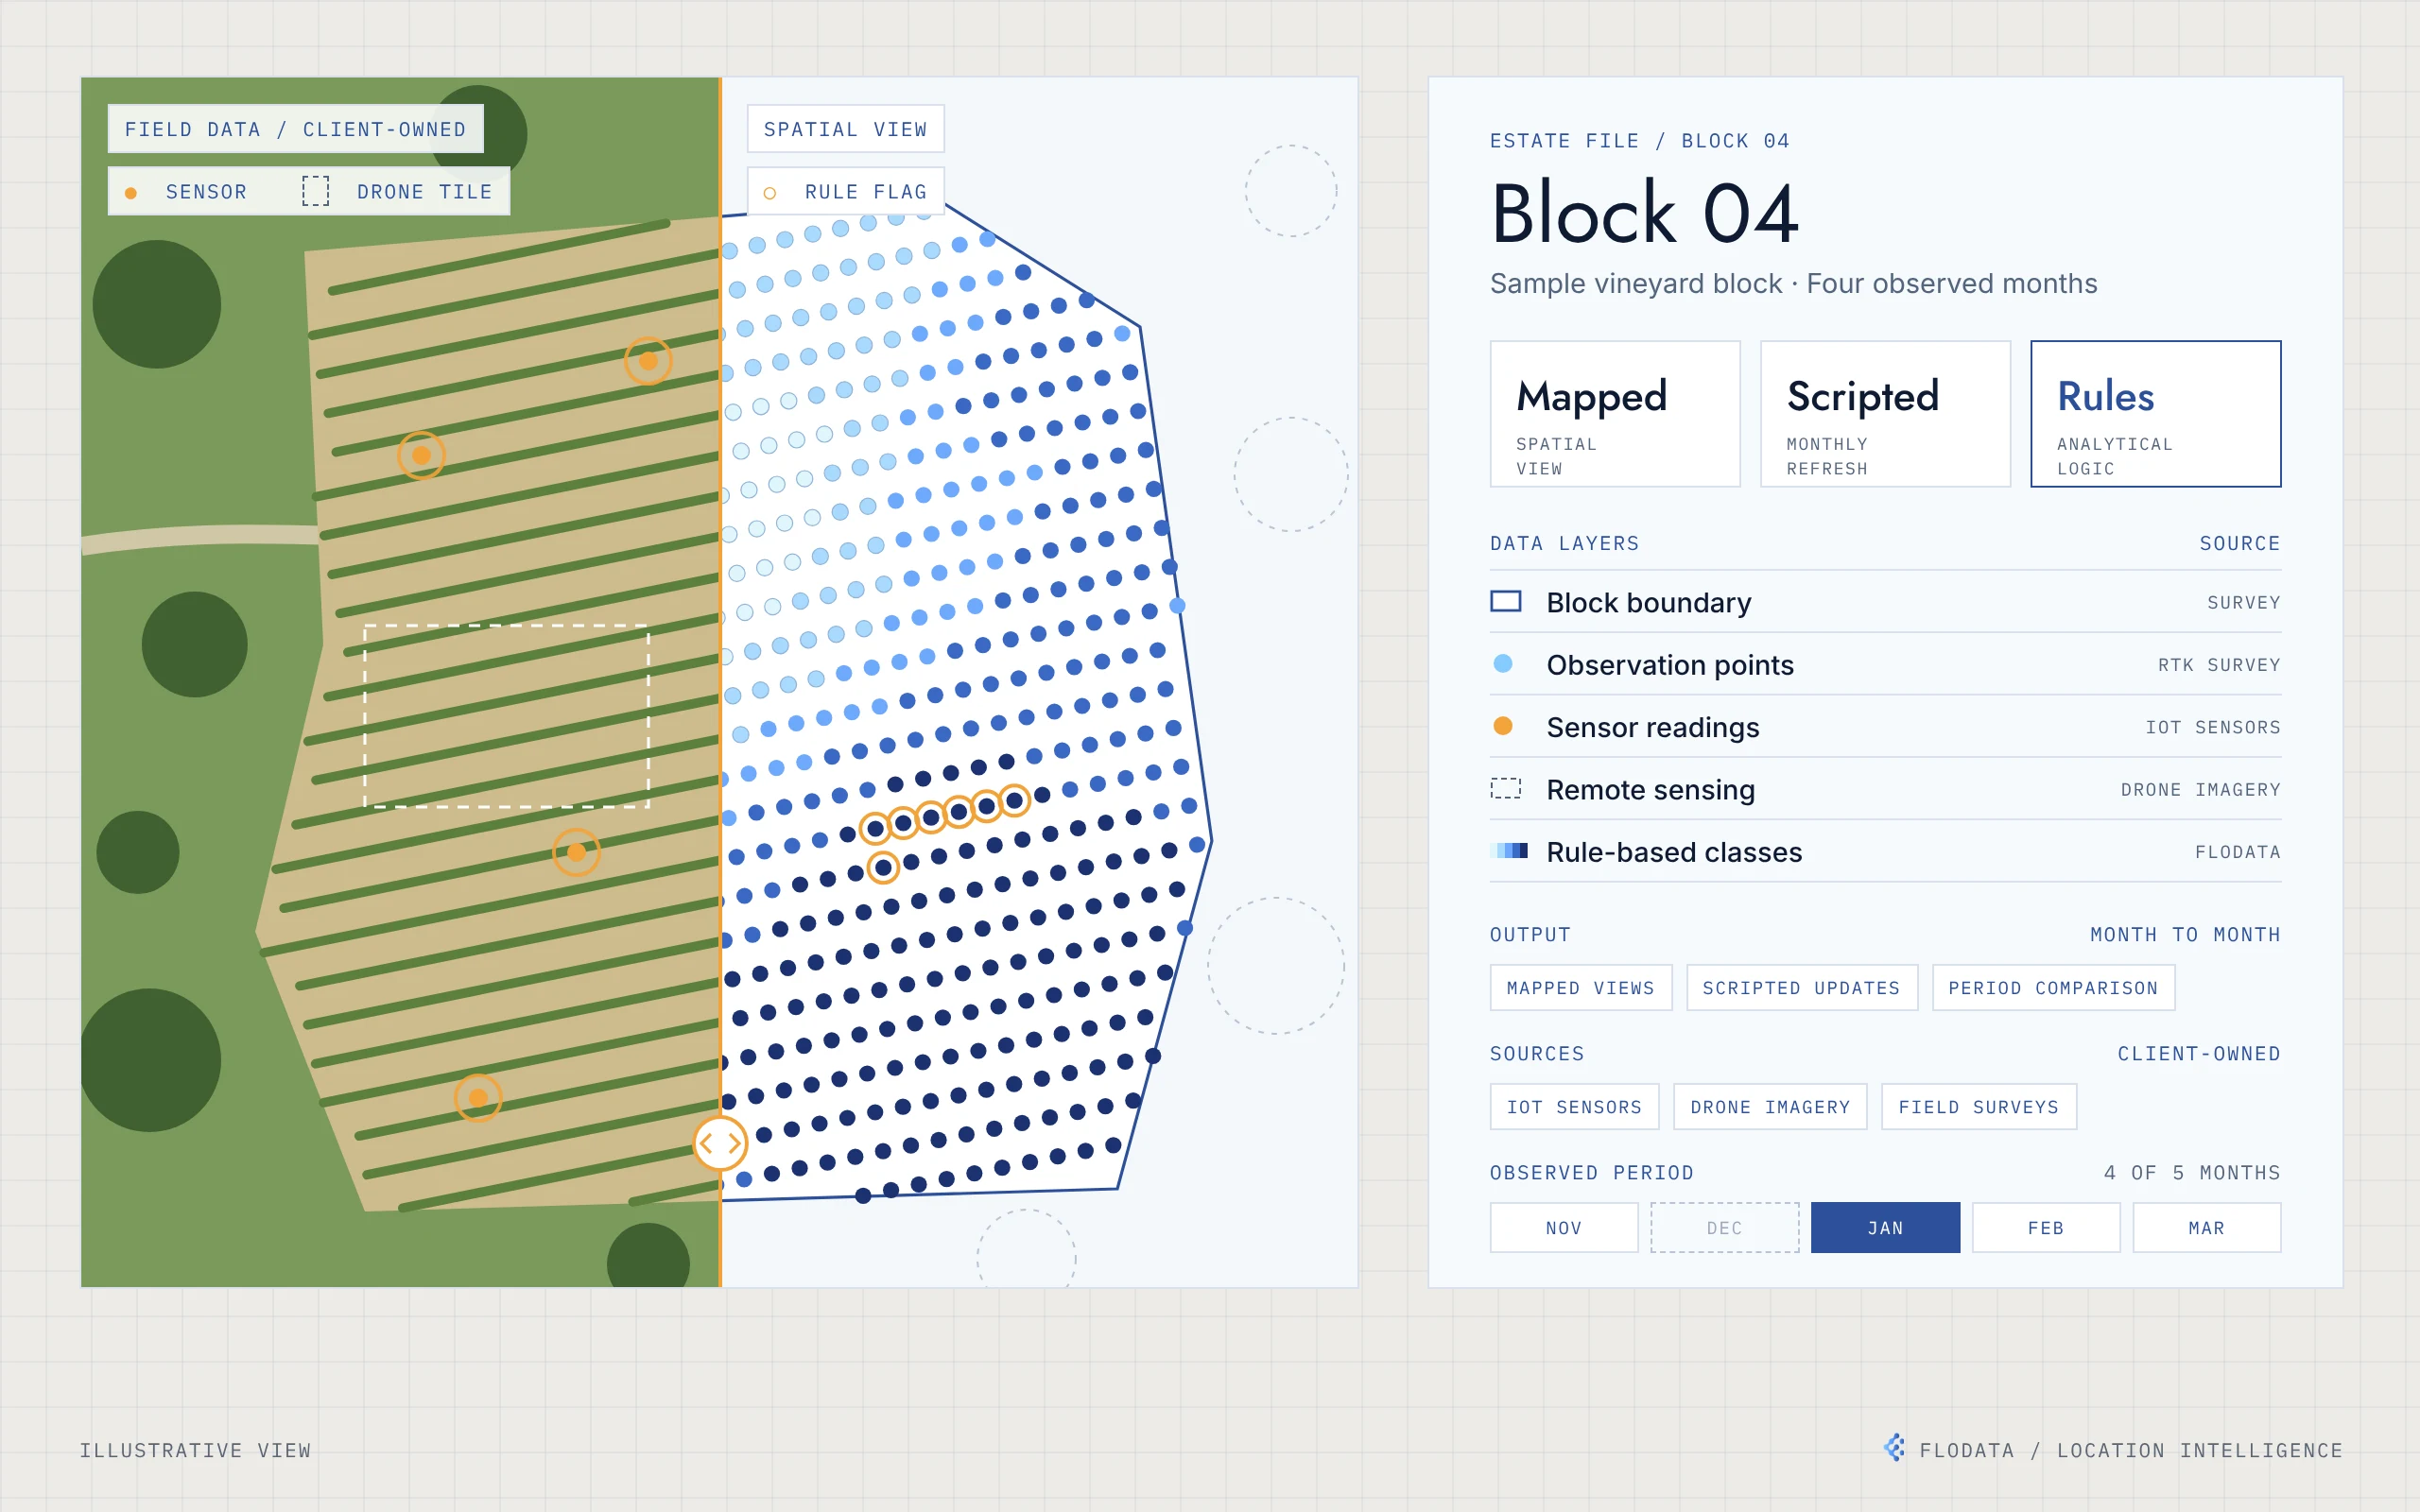
Illustration of one vineyard block split in two: field data on the left, with vine rows, sensor locations and a drone image tile, and the same block on the right as a grid of observation points shaded by class, with a few points flagged by a rule. Beside it, an estate file card lists the data layers and their sources, the outputs and four observed months from November to March, with December marked as not observed.
CASE/11

Putting a vineyard's own data on the map

A vineyard's sensor, imagery and survey data, mapped across the estate and compared month by month.

2022United StatesAgriculture
Location IntelligenceData Engineering & AutomationAnalytics
Under the hoodHide the stack

Desktop GIS mapping · Python automation · Rule-based classification · RTK-referenced points · IoT, drone and survey inputs