Operational views
Dashboards put the exception, workload or next action in view. Metric definitions sit behind the number.

SERVICES / Analytics
Make forecasts and dashboards that answer a specific business question.
RECOGNISE THE PROBLEM
WHAT THE WORK CAN INCLUDE
Dashboards put the exception, workload or next action in view. Metric definitions sit behind the number.
Forecasting and risk models connect estimates to the assumptions and factors that shape them.
Scenario models compare choices and expose the constraints behind a recommendation.
BEFORE THE BUILD
We ask who uses the number and what they do when it changes. We trace the calculation back to the source and test whether its definition holds across teams.
See the FloData MethodFOR THE TECHNICAL EVALUATOR
Illustrative approach. We select the stack after the diagnostic.
RELEVANT WORK
View related work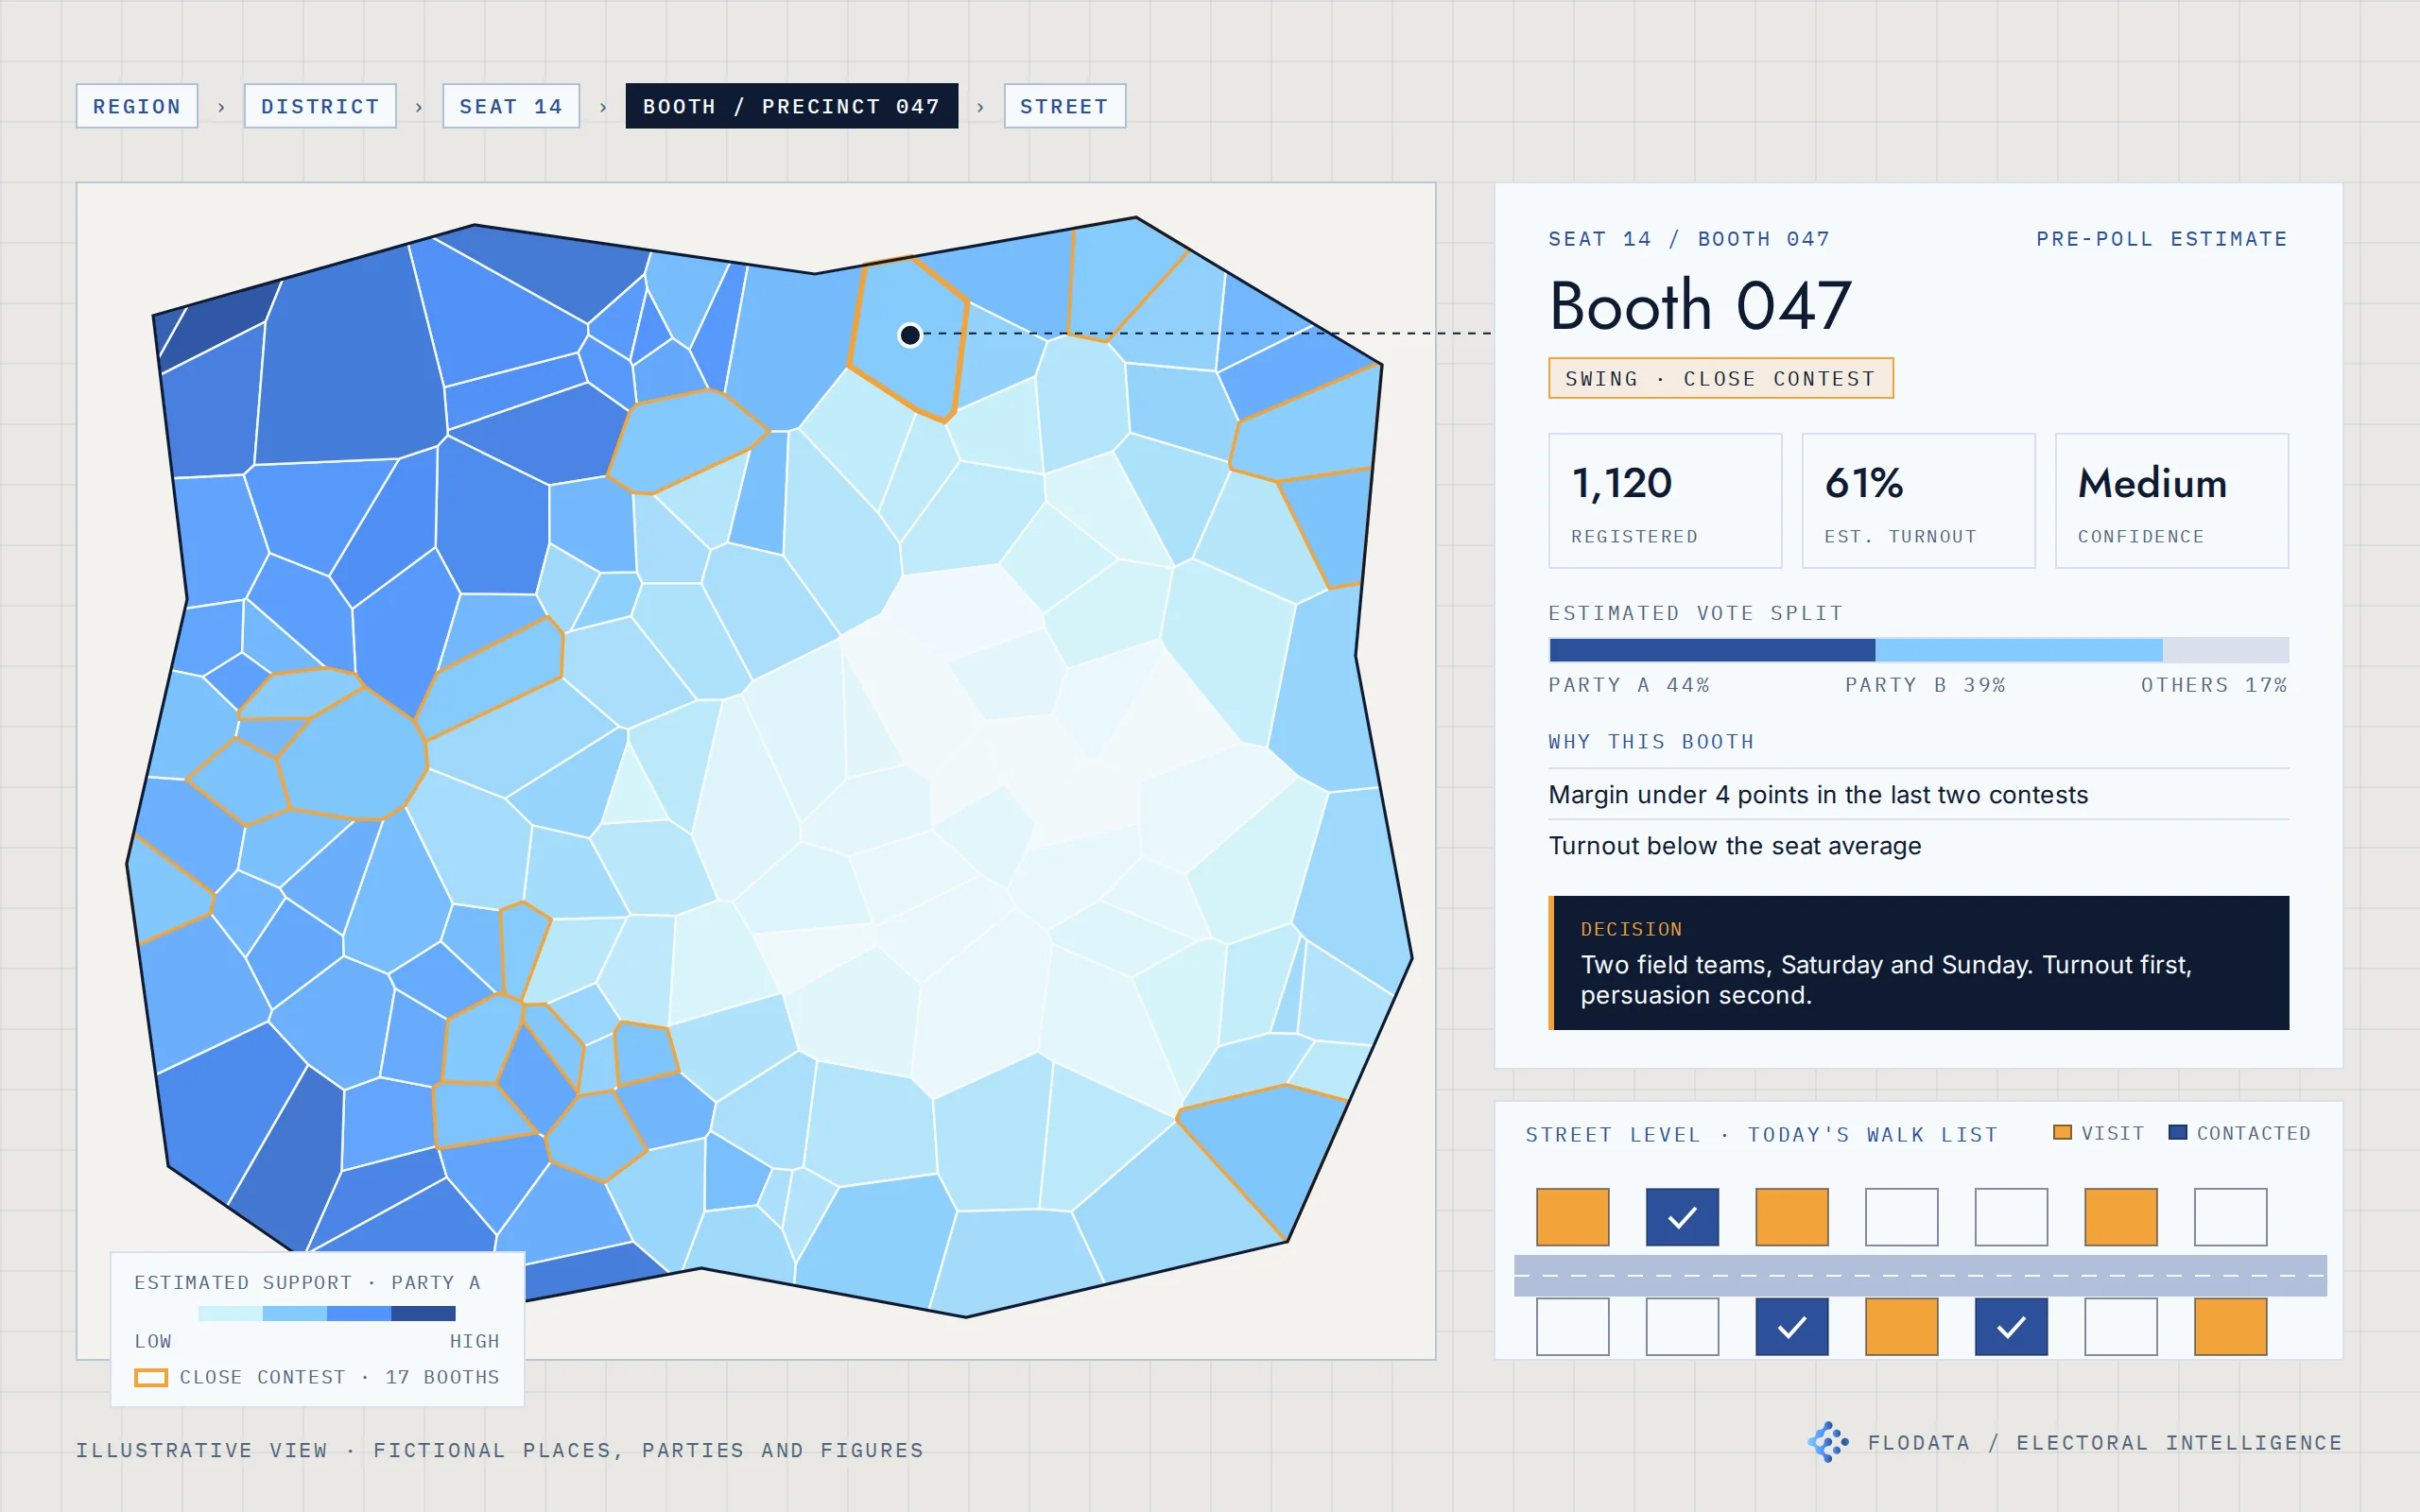
Electoral intelligence for a US campaign and an Indian party organisation. Estimates built from official results, mapped from the seat to the street.
Official results and electoral rolls from public sources · Booth reconciliation across elections · Segment-level turnout and preference model · Bottom-up aggregation with confidence levels · Web maps from region to household · Prediction service with Excel-ready exports · Web dashboard and mobile field app
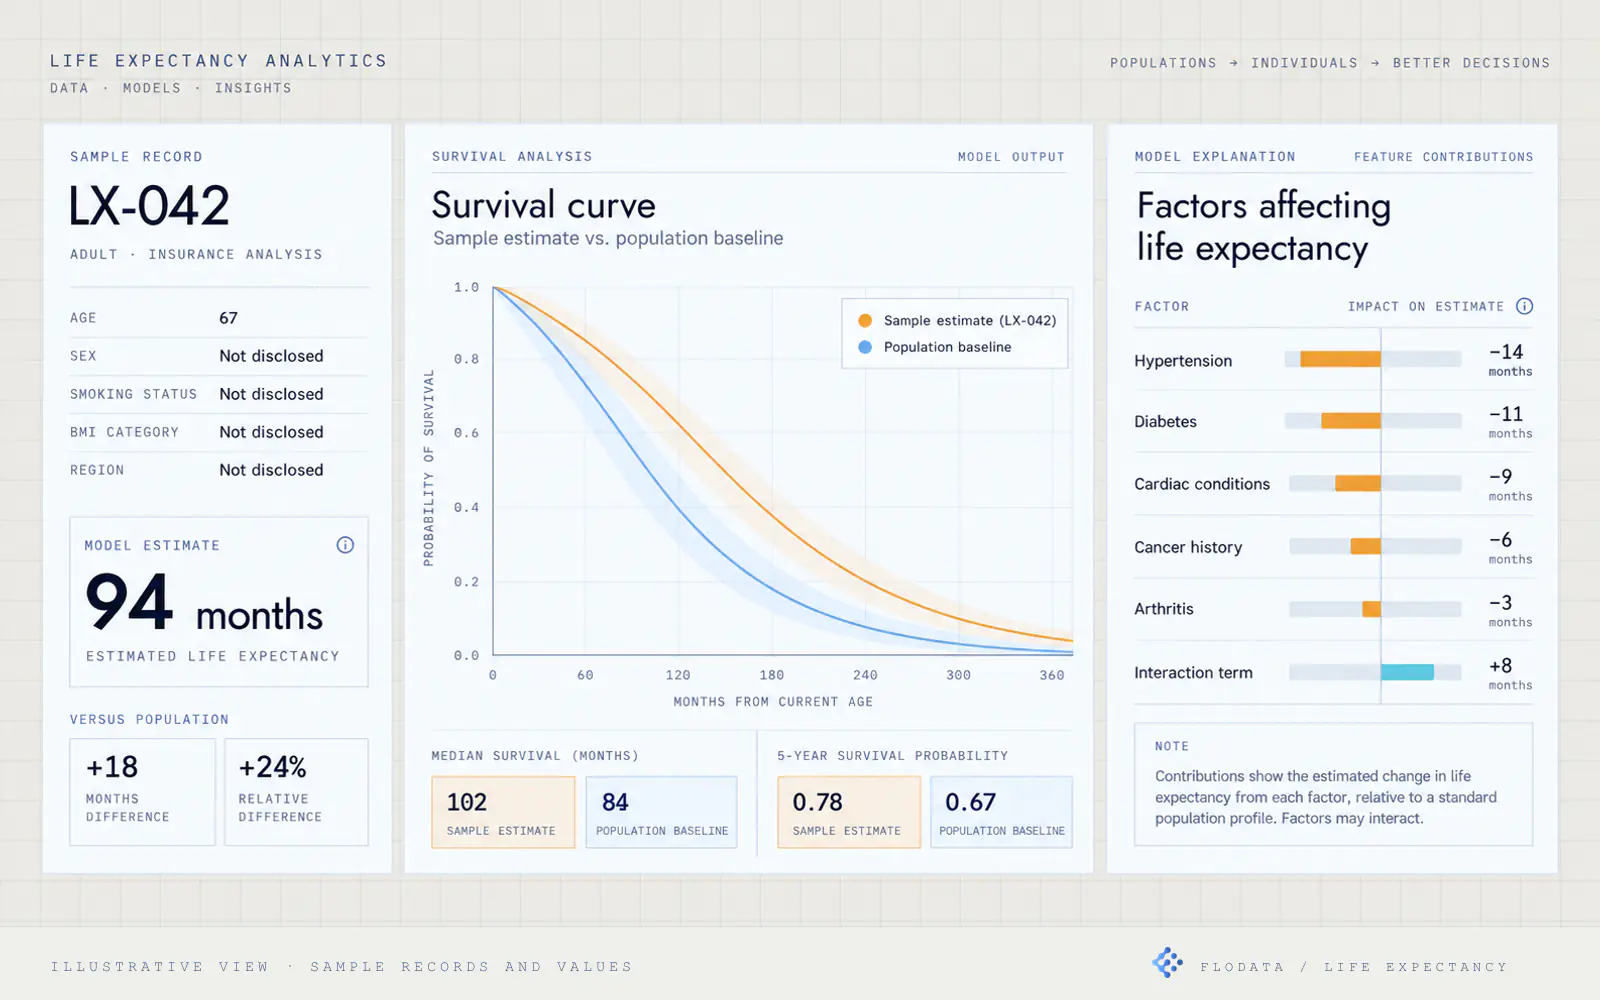
Medical records became a structured, explainable input to life-settlement valuation.
OCR and document classification · NLP-based medical factor extraction · Standardised medical and lifestyle factor set · Cox Proportional Hazards survival model · Baseline and factor-contribution dashboard · Benchmark comparison against industry and internal methods
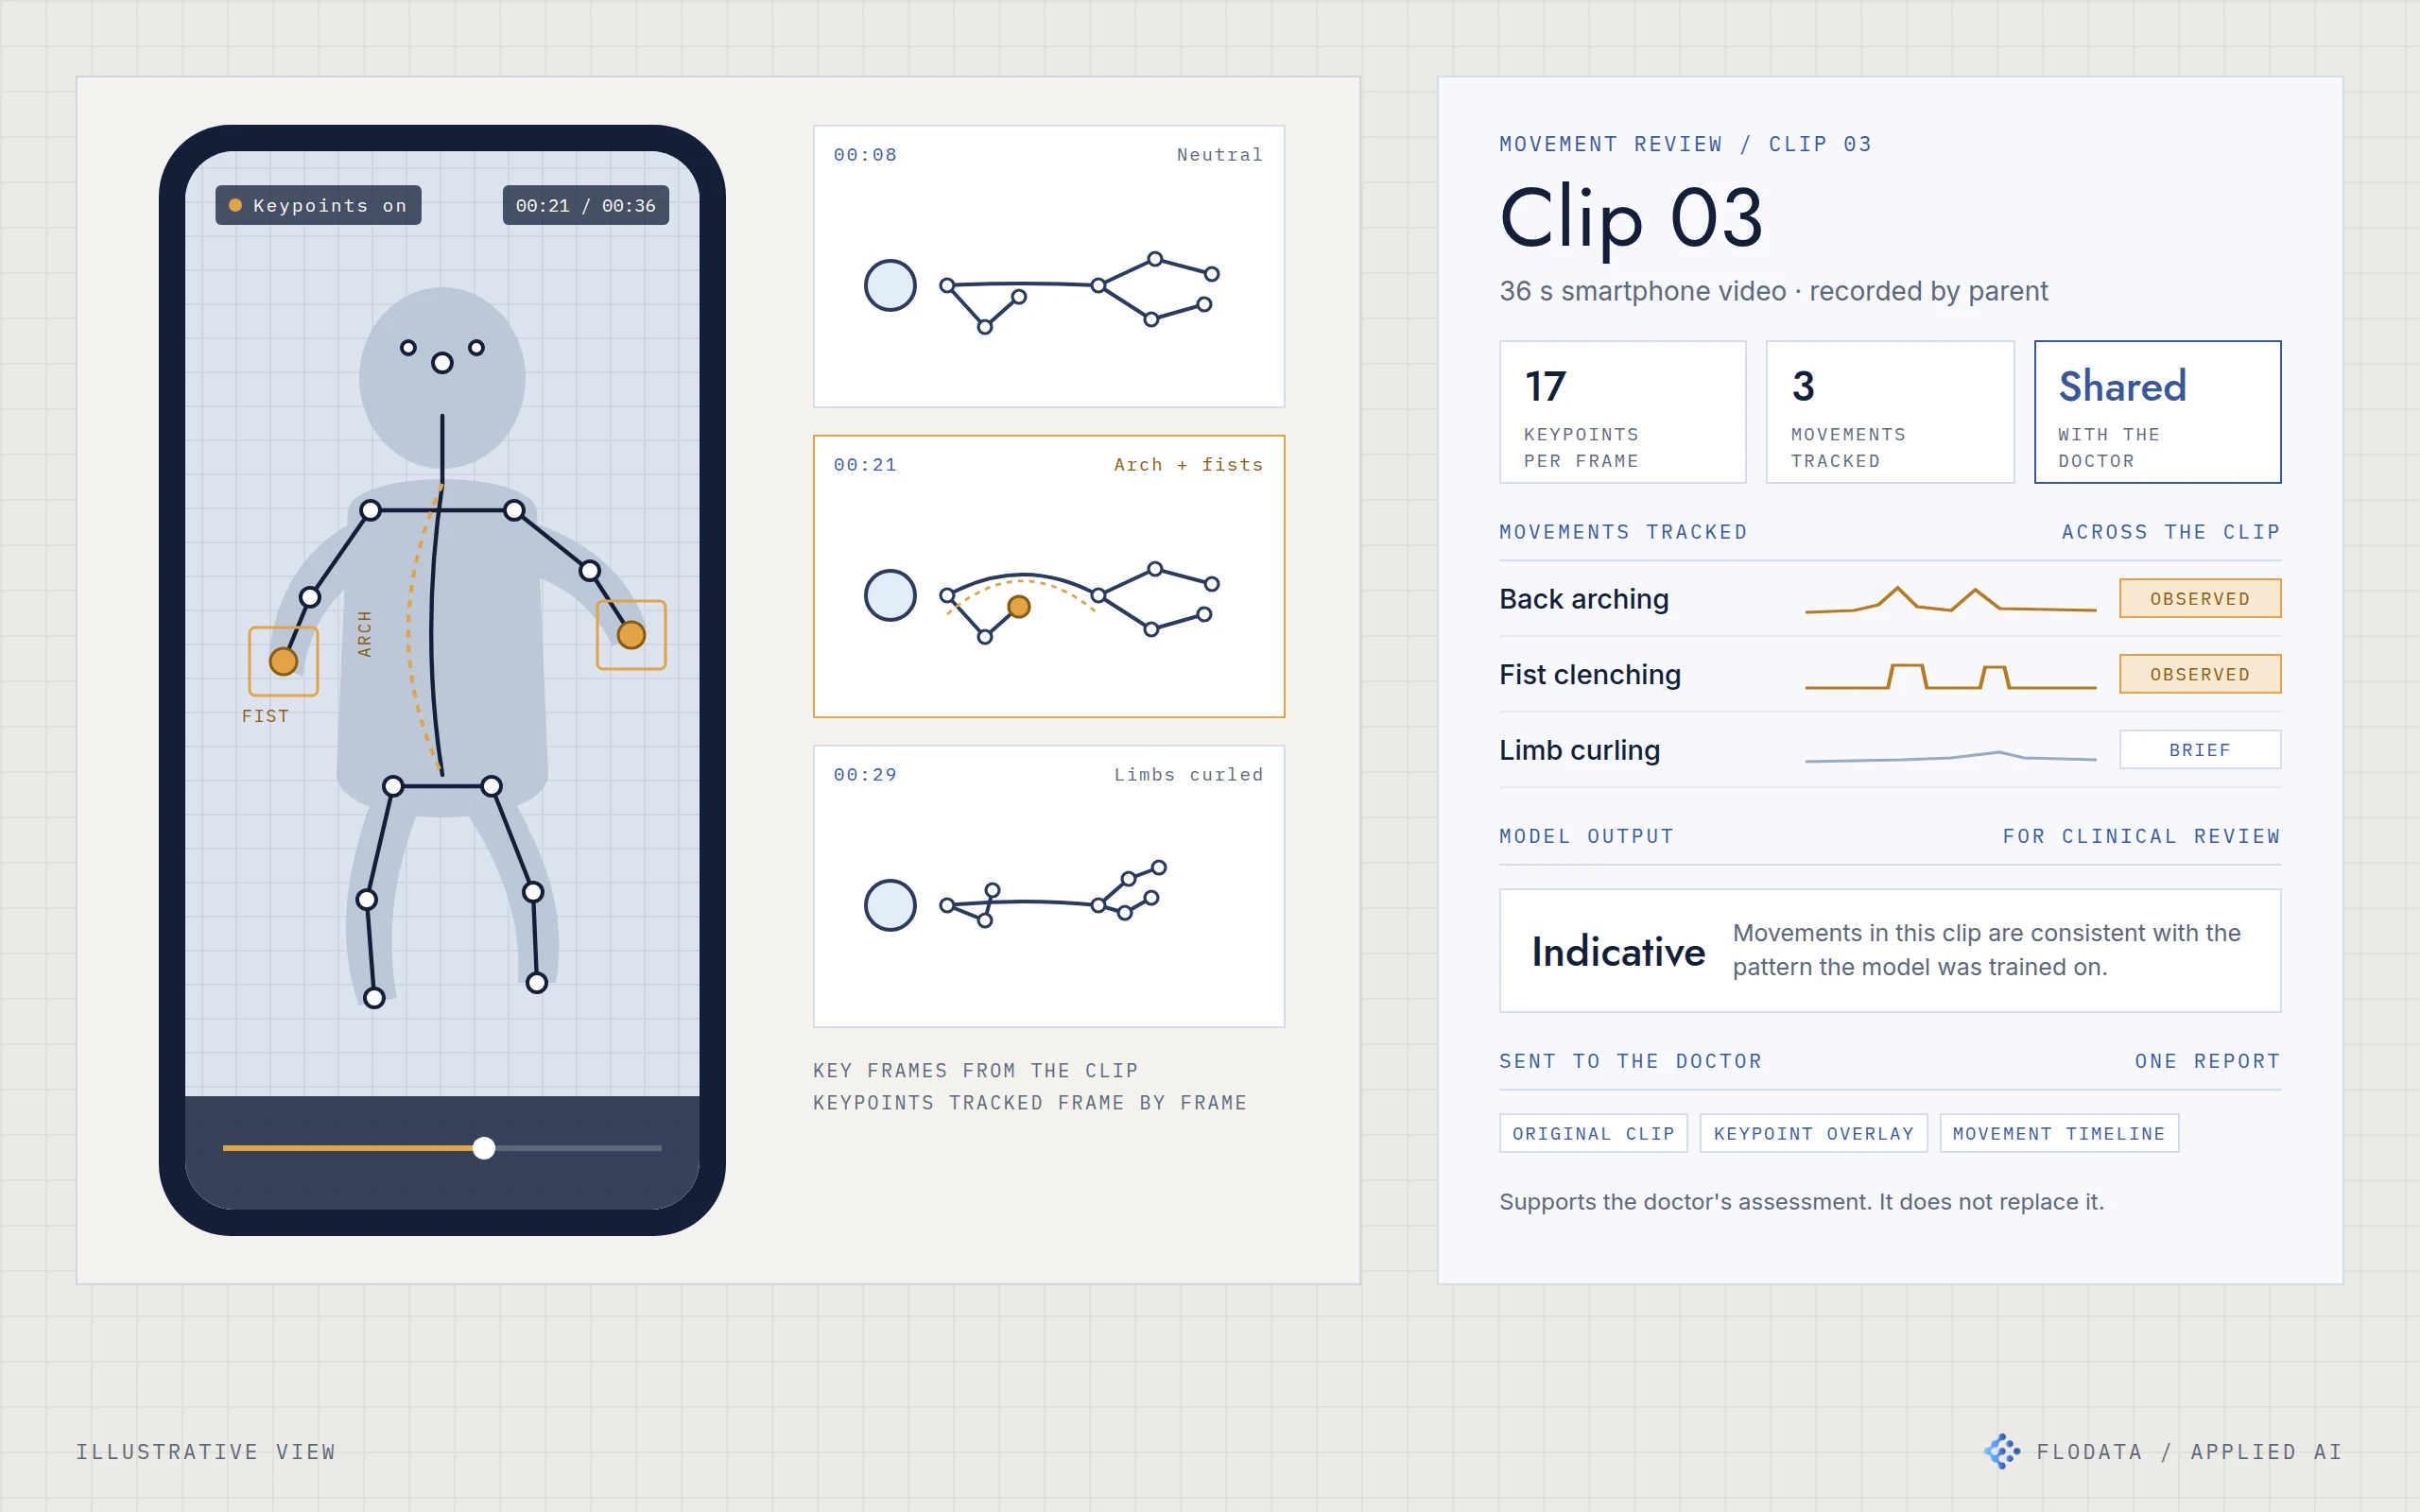
Smartphone videos of children became a measured movement record, so parents and doctors could discuss what they saw with something objective in front of them.
Pose estimation · Keypoint detection · Movement signal extraction · Trained classifier · Clinician-facing report