
CASE/09 / Energy
United StatesHalf the site visits to choose a solar site
Computer vision on satellite imagery screened candidate solar sites before anyone travelled, cutting site visits from ten to five, then helped spot dirt, damage and vegetation on installed panels.
01 / THE ASK
The decision behind the brief.
Choosing where to build a solar installation took repeated site visits. Terrain, shadows, trees and buildings all affect whether a site works, and they were checked on the ground, one site at a time. Once panels were in, keeping them performing meant spotting dirt, discolouration and creeping vegetation across large arrays, which was slow and easy to miss. The client wanted both jobs done from imagery first.
02 / WHAT WE FOUND
What the work revealed.
Most of what rules a site in or out can be seen from above. Open land, tree cover, buildings and shadow show up clearly in satellite imagery, and each one can be measured. Visits were being spent confirming things that imagery could already answer. The same was true after installation: dirt, colour change and vegetation on panels leave a visible signature that a model can learn to find.
03 / WHAT WE BUILT
Screen from above. Visit only the best.
Classify the terrain
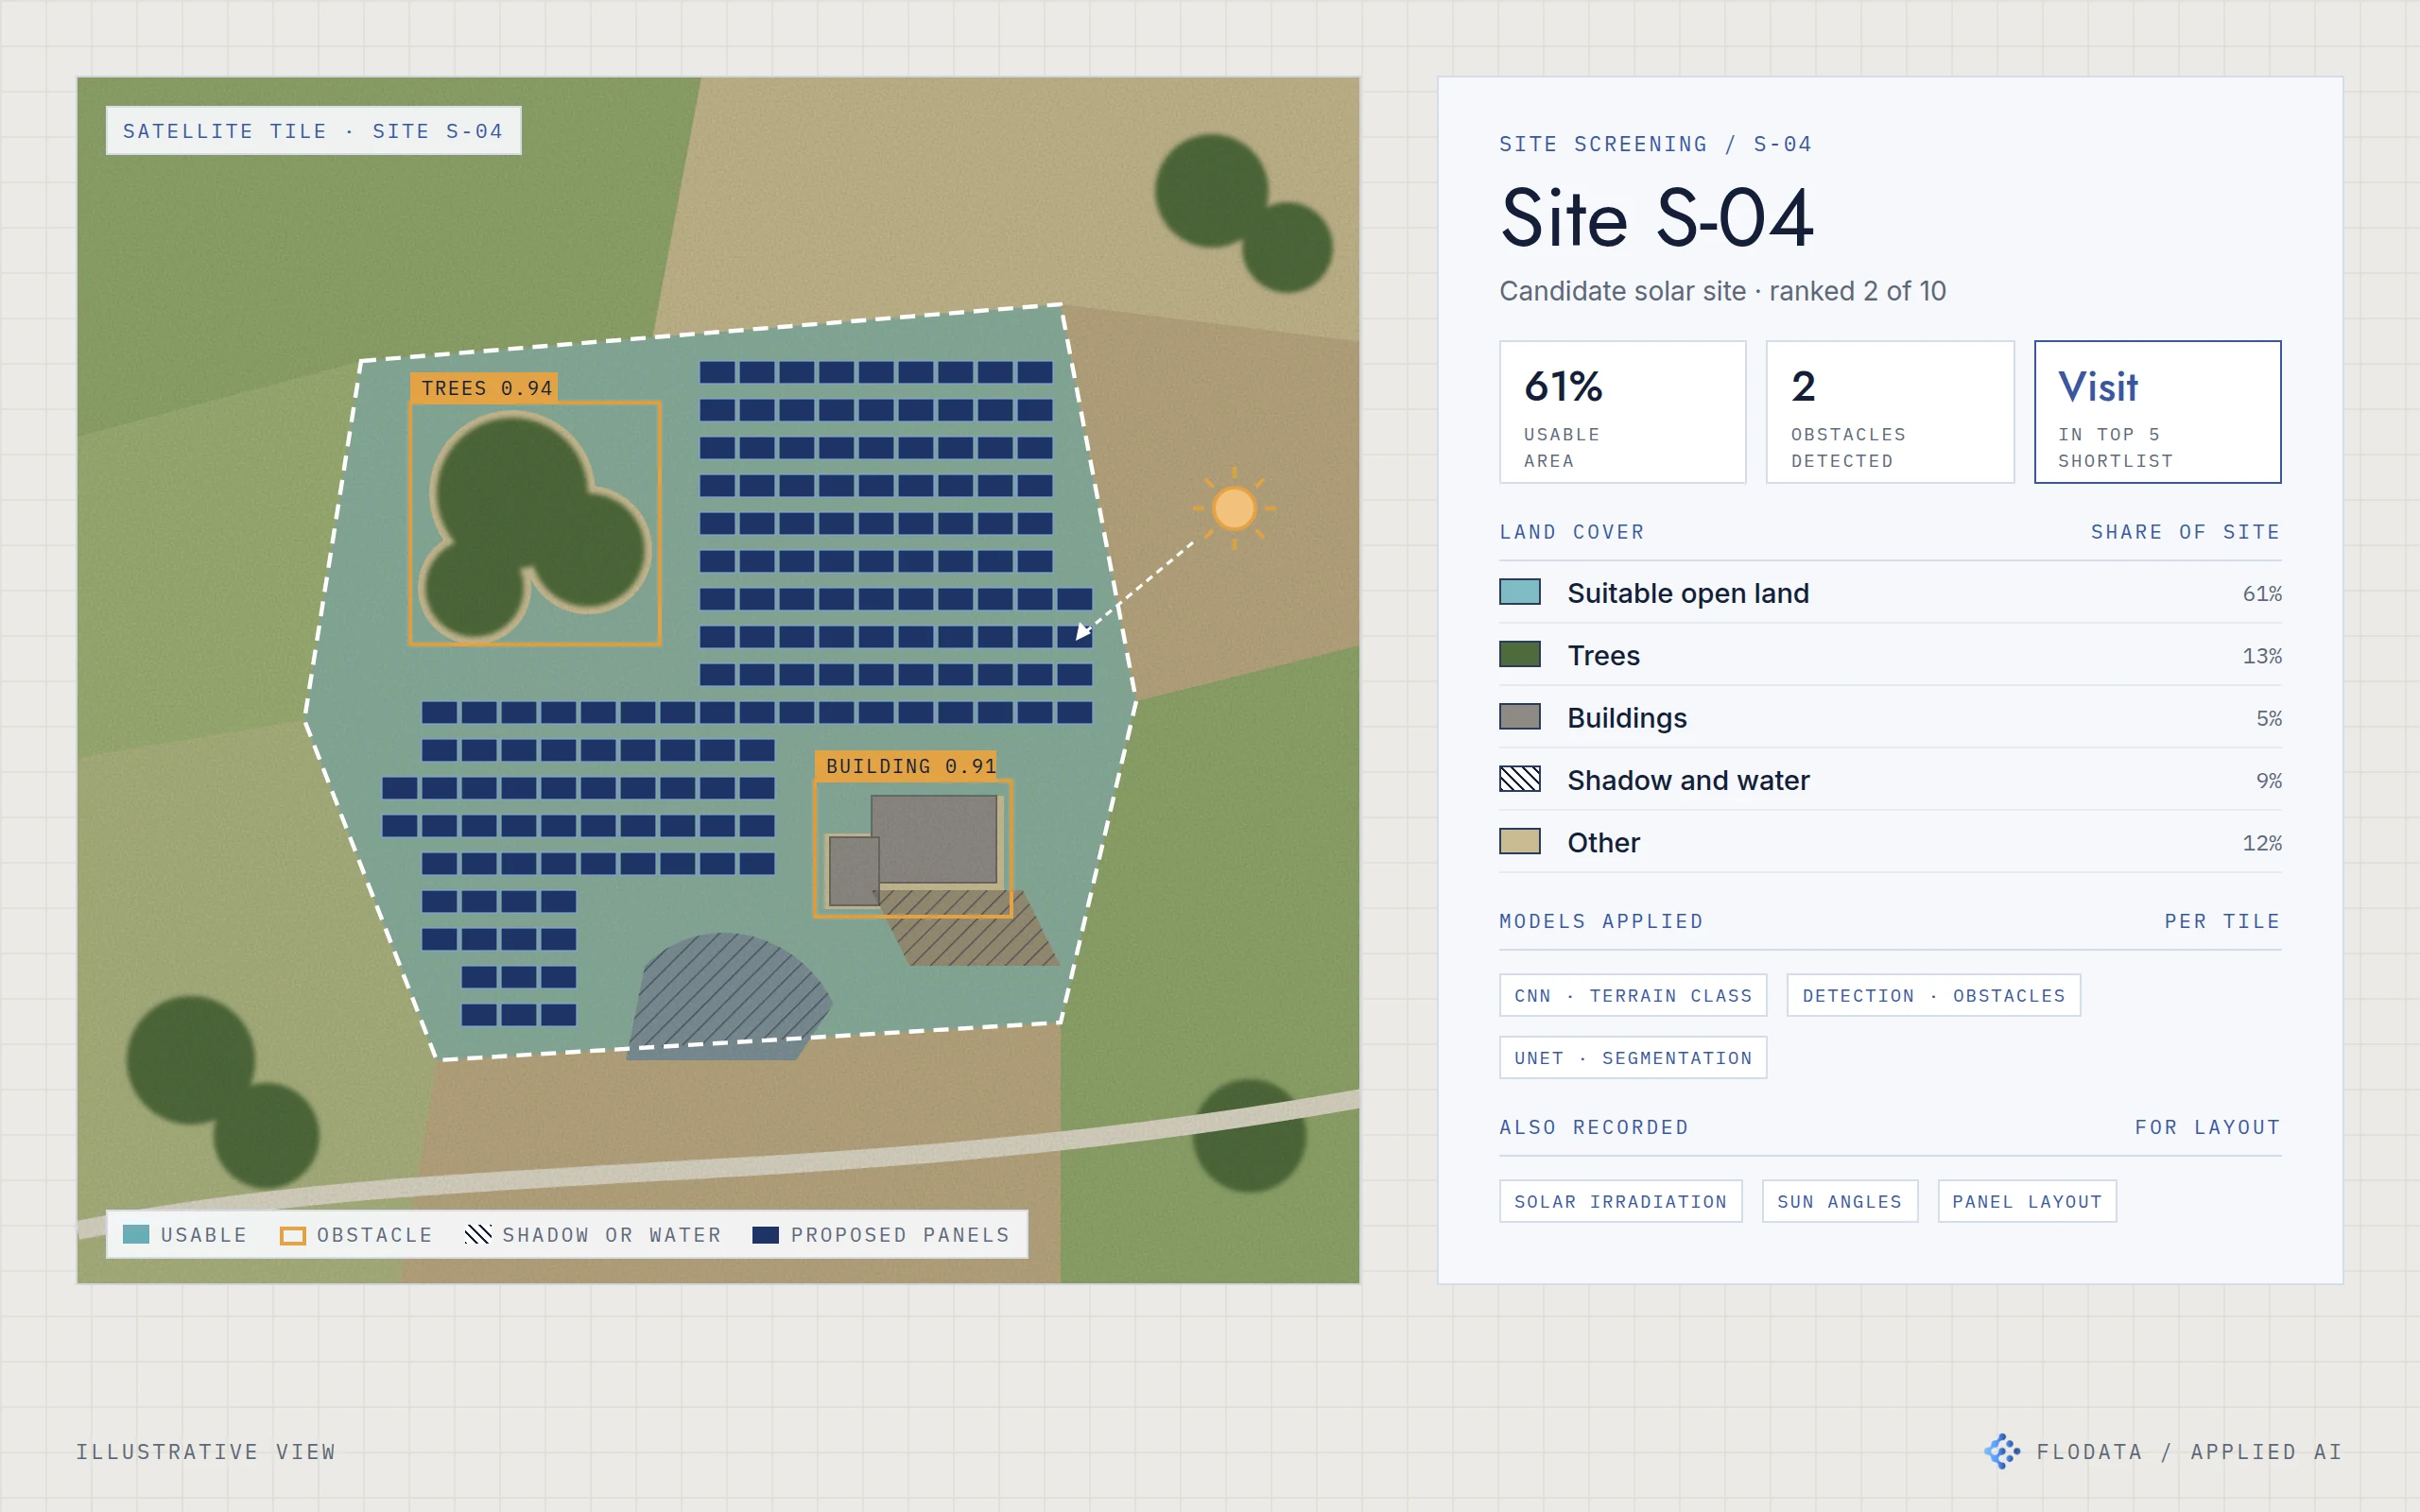
Convolutional neural networks classify satellite imagery by terrain type, which gives a first read on land suitability for each candidate site.
Detect obstacles
Object detection models (YOLO and Faster R-CNN) find trees, buildings and other obstacles that would block a panel layout.
Segment the usable land
UNet segmentation maps each site into usable open land, trees, buildings, shadow and water, and shows where panels could go. The system also records solar irradiation and sun angles to inform the layout.
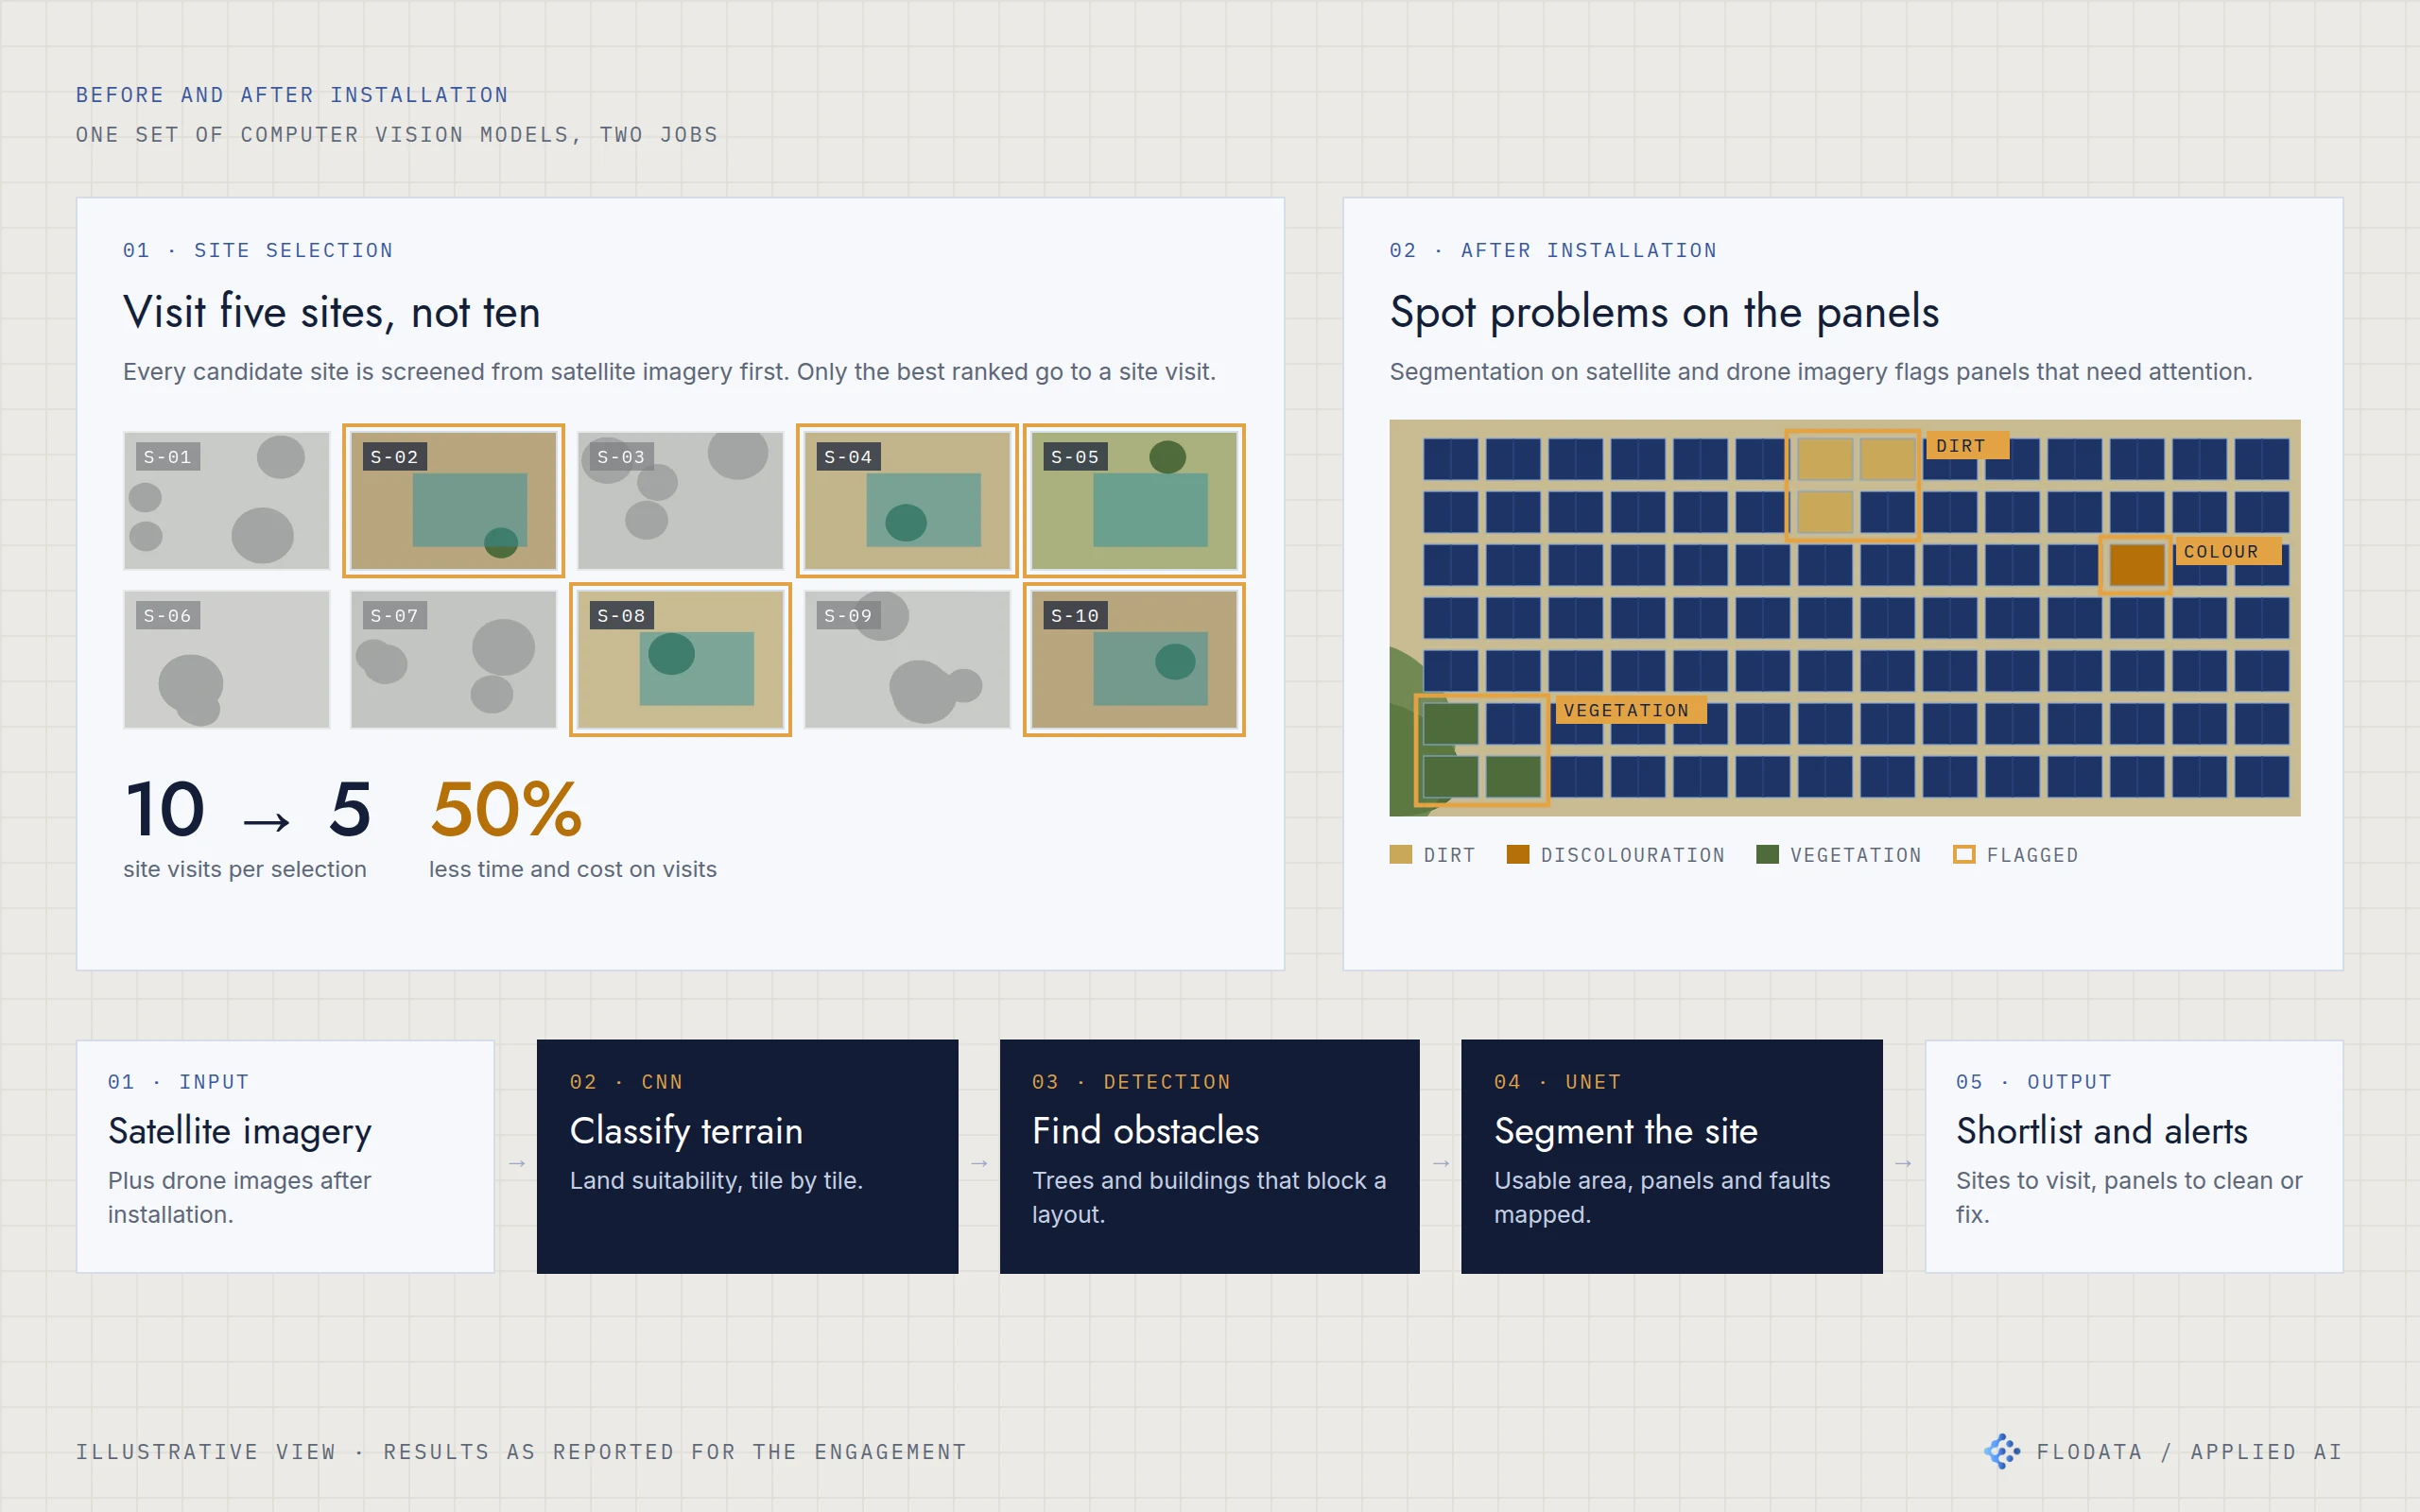
Ten candidate sites screened from imagery, five shortlisted for a visit. After installation, the same segmentation approach flags dirt, discolouration and vegetation on the panels.
Rank and shortlist
Each candidate site is scored and ranked. Only the top-ranked sites go to a physical visit.
Watch the panels after installation
Segmentation on satellite imagery flags dirt build-up so cleaning can be scheduled, finds panel damage and discolouration early, and picks up vegetation encroaching on the array. [CONFIRM: which of these were delivered, see question 2]
Add drones for fault checks
The models were integrated with autonomous drones so faults are found on scheduled flights instead of frequent manual inspections. [CONFIRM: see question 3]
04 / THE RESULT
Half the site visits.
Choosing a site used to need ten site visits. With imagery screening first, only the top five go to a visit, which halves the time and cost spent on visits. After installation, the client has an earlier view of panels that need cleaning, repair or clearing, with less need for constant on-site supervision.
05 / ENGINEERING DETAILUnder the hood
- Satellite imagery
- Classify terrain
- Detect obstacles
- Segment the site
- Shortlist and panel alerts
Terrain classification. CNNs classify satellite tiles by terrain to assess land suitability.
Obstacle detection. YOLO and Faster R-CNN detect trees, buildings and other obstacles in candidate sites.
Segmentation. UNet segments sites into land cover classes and identifies installable area. After installation, segmentation flags dirt, discolouration and vegetation on panel arrays.
Solar inputs. Solar irradiation and sun angles are recorded for each site to support layout decisions.
Drones. Model outputs integrated with autonomous drone inspection for fault detection. [CONFIRM]
- CNN terrain classification
- YOLO and Faster R-CNN detection
- UNet segmentation
- Irradiation and sun angle data
- Drone inspection integration